
Reason to trust
How Our News is Made
Strict editorial policy that focuses on accuracy, relevance, and impartiality
Ad discliamer
Morbi pretium leo et nisl aliquam mollis. Quisque arcu lorem, ultricies quis pellentesque nec, ullamcorper eu odio.
- ETH price started a major consolidation after a nasty upward move above $120 against the US Dollar.
- There is a contracting triangle in place with resistance at $124 on the 4-hours chart of ETH/USD (data feed via Kraken).
- The pair is likely to accelerate higher once it breaks the $124 and $125 resistance levels in the near term.
- On the other hand, a break below $119 might call for more declines towards the $114 or $110 level.
Ethereum price is placed nicely in a positive zone versus the US Dollar and Bitcoin. ETH/USD could soon make the next move either above $125 or below the $119 support.
Ethereum Price Analysis
This past week, there was a solid upward move above the $120 resistance in ETH price against the US Dollar. The ETH/USD pair traded towards the $125 area, where sellers emerged. Later, the price started a major consolidation pattern below the $125 zone. During the consolidation, there were a few attempts to clear the $125 resistance, but buyers failed. Besides, there were bearish waves as well towards the $120 level. The last swing low was formed at $115 and the last swing high was near $124. The price is currently trading near the $122 level and well above the 100 simple moving average (4-hours).
The 23.6% Fib retracement level of the last wave from the $115 low to $124 high is near the $122 level to act as a support. It seems like there is a contracting triangle in place with resistance at $124 on the 4-hours chart of ETH/USD. If there is an upside break above the triangle resistance and $125, there are chances of a solid upside continuation. The next resistance above $125 is near the $128 and $130 levels. The main resistance is at $134, where sellers are likely to appear.
On the other hand, if there is a downside break below the $120 and $119 supports, there could be more losses. The next key support is at $118 and the 61.8% Fib retracement level of the last wave from the $115 low to $124 high. Below $118, the price could test $116 and the 100 simple moving average (4-hours).
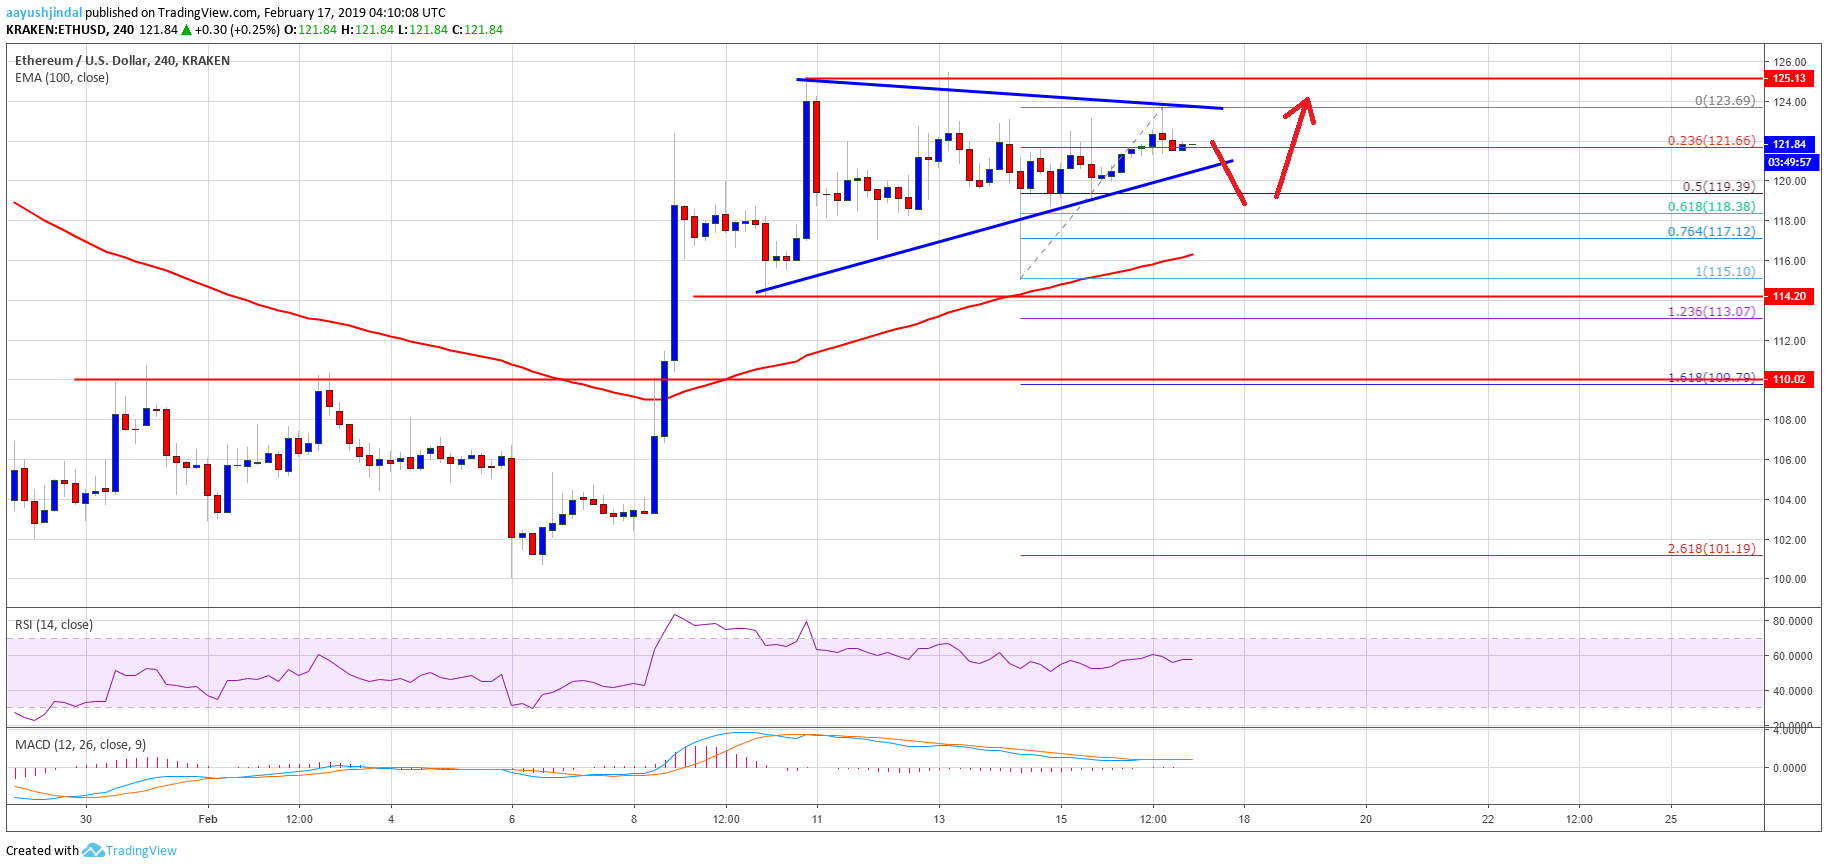
The above chart indicates that ETH price is likely preparing for the next key break either above $124 or below $119 in the near term. Even if there is a downside break, the price remains supported above $115.
Technical Indicators
4 hours MACD – The MACD for ETH/USD is about to move back in the bullish zone.
4 hours RSI – The RSI for ETH/USD is currently well above the 50 level.
Major Support Level – $115
Major Resistance Level – $125


