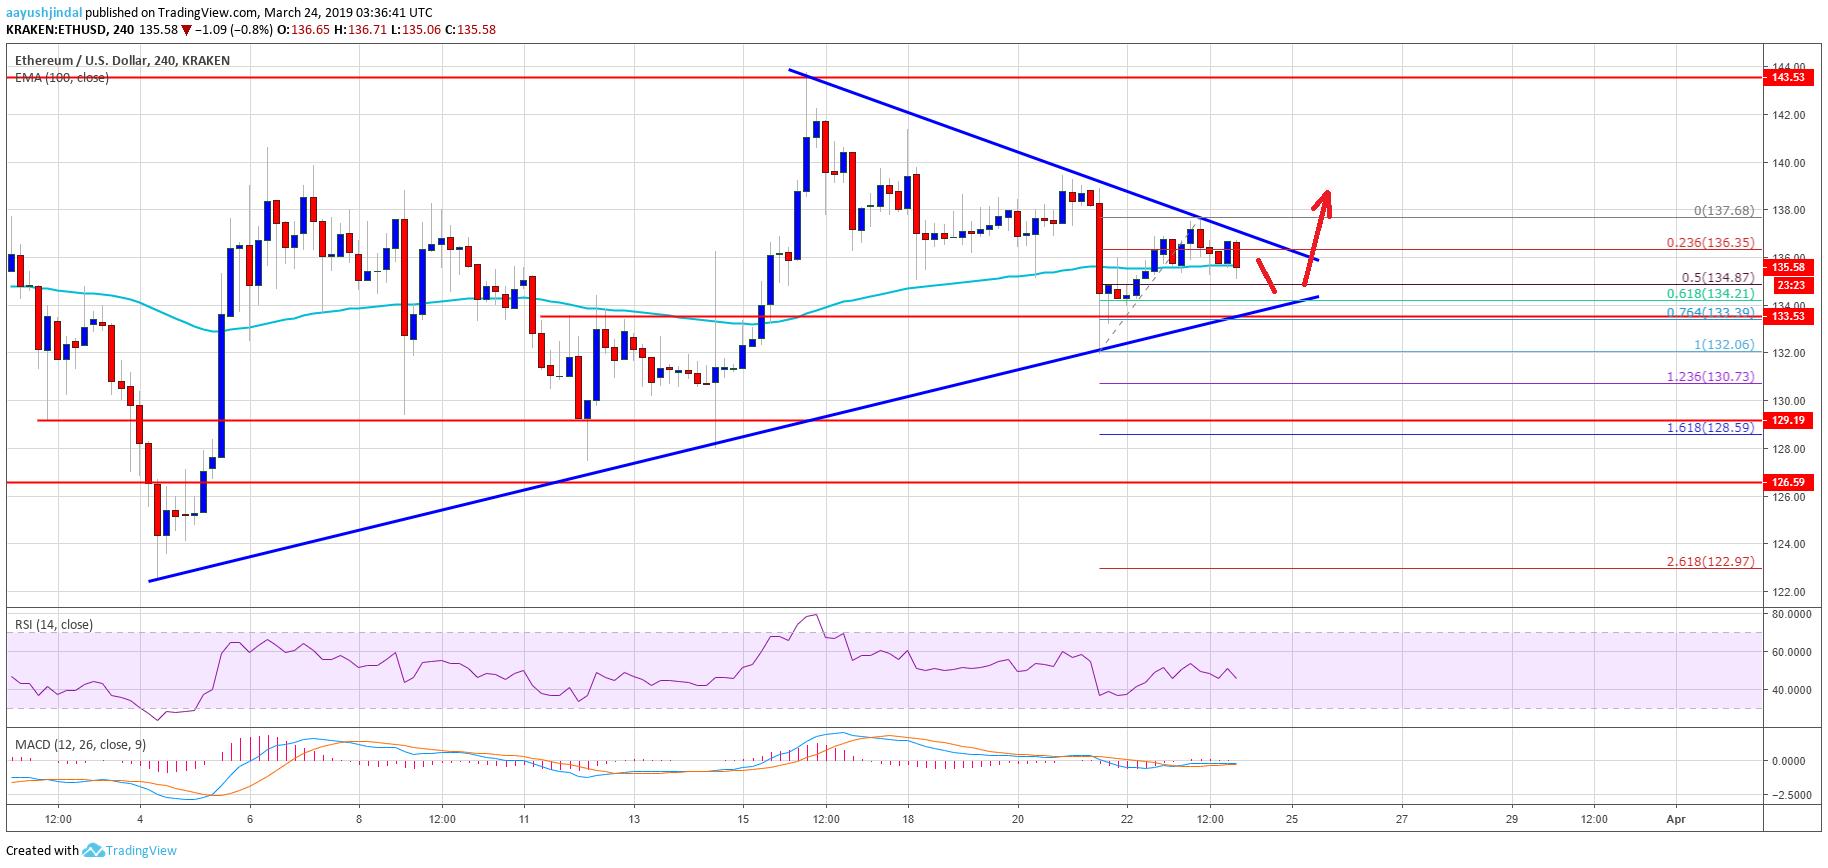
- ETH price declined recently, but it found a strong support above $132 against the US Dollar.
- The price recovered and it is now facing a solid resistance near the $137-138 zone.
- There is a major breakout pattern formed with resistance at $138 on the 4-hours chart of ETH/USD (data feed via Kraken).
- The pair is likely to accelerate higher once there is a proper break above $138 and $140.
Ethereum price is aligning for the next move versus the US Dollar and Bitcoin. ETH/USD will most likely climb higher as long as there is no close below the $132-133 support area.
Ethereum Price Analysis
After forming a stop near the $144 level, there was a steady decline in ETH price against the US Dollar. The ETH/USD pair declined below the $140 support level to move into a bearish zone. Later, it found support near the $135 level, but buyers failed to hold losses. Finally, there was a downside break below the $135 support and the 100 simple moving average (4-hours). The price declined below the $134 support and traded close to the $132 support area.
Recently, the price recovered and moved above the $135 level. However, the price seems to be facing a strong resistance near the $137-138 area. At the moment, it is trading near the $135 level and the 100 simple moving average (4-hours). An immediate support is near the 50% Fib retracement level of the last wave from the $132 low to $138 high. More importantly, there is a major breakout pattern formed with resistance at $138 on the 4-hours chart of ETH/USD.
The triangle support is near the $134 level, below which the next key support is near the $132 level. It seems like the price is preparing for the next move either above $138 or below $134. On the downside, there are many supports near the $134, $133 and $132 levels. Therefore, there are high chances of an upside break above the $137-138 resistance area.

The above chart indicates that ETH price is likely to climb above the $137-138 resistance area. In the mentioned bullish scenario, the price could even break the $140 resistance and revisit the $144 resistance area. The next key resistance is near the $148 level, followed by $150. On the flip side, if buyers fail to push the price above $138, there could be a downside reaction. A break below the $132 support may call for a test of the $130 support.
Technical Indicators
4 hours MACD – The MACD for ETH/USD is currently flat, with a few positive signs.
4 hours RSI – The RSI for ETH/USD is currently below the 50 level, with a bearish angle.
Major Support Level – $134
Major Resistance Level – $138


