

Key Highlights
- Ethereum price finally moved higher and broke the consolidation to register gains intraday vs the US Dollar and Bitcoin.
- Yesterday’s highlighted bearish trend line on the hourly chart (data feed via Kraken) of ETH/USD was broken during the upside drift.
- The price looks like may be heading towards the last swing high of $10.40 where it may find offers.
Ethereum price surged higher and broke a major resistance area. Buying dips in the short term may be considered eyeing a test of $10.40.
Ethereum Price Buy Dips?
Ethereum price ETH managed to break a range pattern vs the US Dollar and popped higher. During the upside move ETH/USD managed to break a couple of important barriers, including a bearish trend line on the hourly chart (data feed via Kraken). The most important move was above the 100 hourly simple moving average, which is a signal that the ETH bulls are in control at present.
The price almost tested the $10.0 handle, and currently consolidating gains. I think there is a high probability of it testing the last swing high of $10.40. However, a correction from the current levels cannot be discarded. If ETH moves down, then it may find support near the 23.6% Fibonacci retracement level of the last wave from the $8.40 low to $9.99 high.
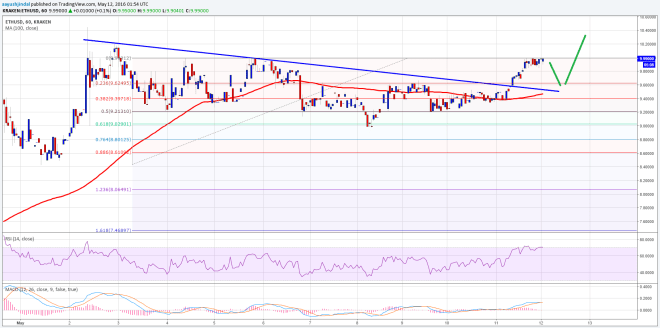

However, the most important support is near the broken trend line, as it is also positioned near the 100 hourly simple moving. Buying dips may be considered as long as the price is above the 100 SMA (which can be a stop price).
Hourly MACD – The MACD is about to move from the bullish to bearish slope, calling for a minor downside move.
Hourly RSI – The RSI is around the overbought levels, which is another sign of a correction.
Intraday Support Level – $9.60
Intraday Resistance Level – $10.40
Charts courtesy of Kraken via Trading View
Image via NewsBTC