Key Highlights
- ETH price managed to trade higher above $10.20 against the US Dollar, but failed to hold gains.
- There was a bearish trend line (as highlighted in yesterday’s post) on the hourly chart (data feed via SimpleFX) of ETH/USD, which was cleared for an upside move.
- The price traded as high as $10.37 where it found sellers and moved down.
Ethereum price after an upside move towards $10.40 versus the US Dollar failed. ETH/USD is now back trading below $10.20 with support near $9.60.
Ethereum Price Failed Upside?
Yesterday, there were a few bearish signs for ETH price against the US Dollar, but later it found support and started moving higher. The upside move was strong, as the price moved past a couple of important resistance levels. First, the 50% Fib retracement level of the last decline from the $10.58 high to $9.00 low was cleared. Second, the price managed to clear the 100 hourly simple moving average at $9.45.
The most important move was above yesterday’s highlighted bearish trend line on the hourly chart (data feed via SimpleFX) of ETH/USD. It opened the doors for further gains, and the price moved above the 61.8% Fib retracement level of the last decline from the $10.58 high to $9.00 low. There was a new intraday high formed near $10.37 where sellers emerged and pushed the price down.
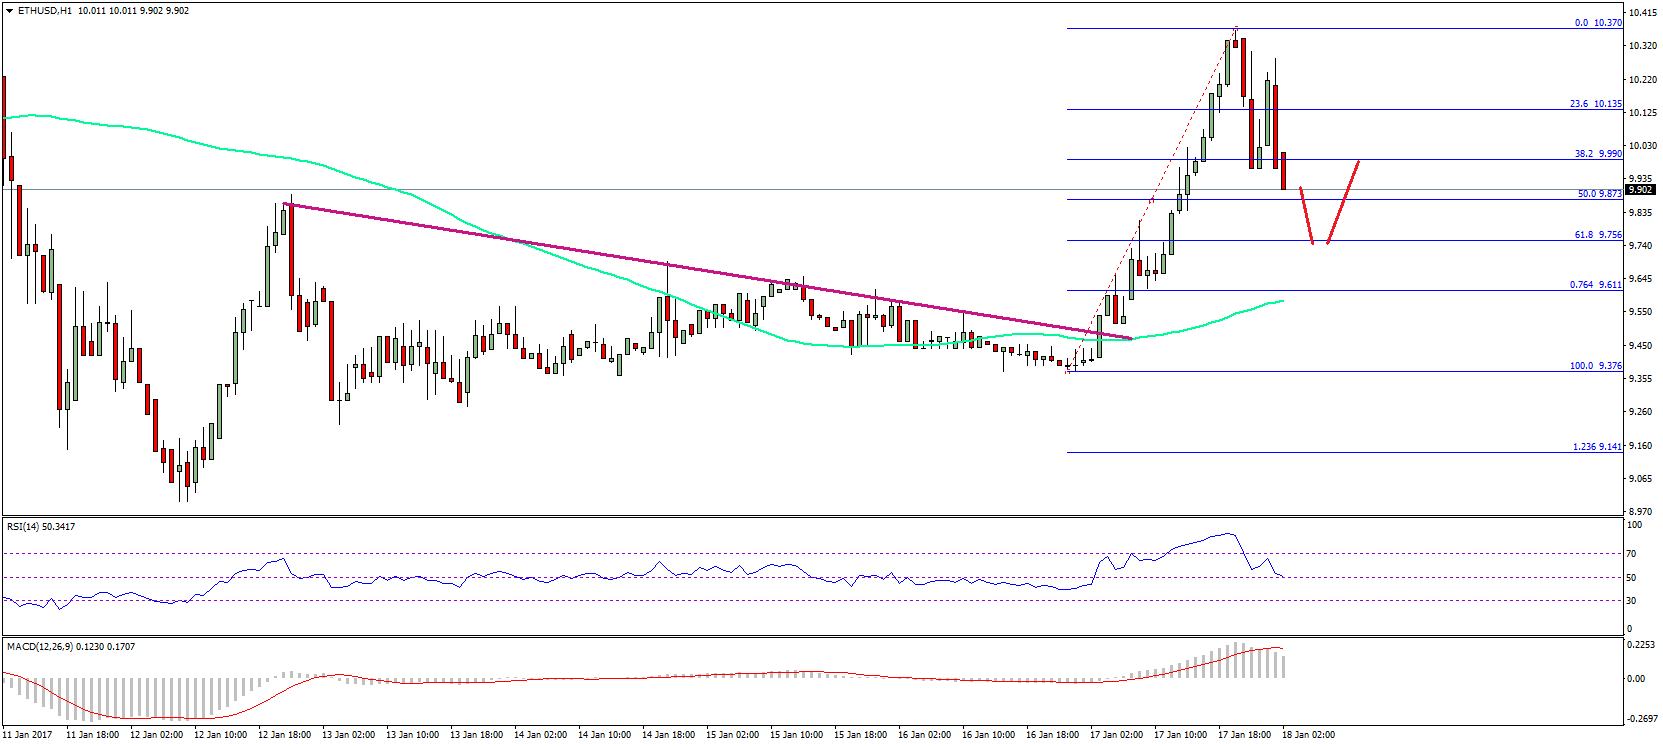
There looks like a strong rejection pattern, as the price moved down below the 38.2% Fib retracement level of the last wave from the $9.37 low to $10.37 high. The last few candles on the chart are bearish, and suggest that the price may correct further towards the $9.75 level or even test $9.60.
Hourly MACD – The MACD is reducing the newly formed bullish slope.
Hourly RSI – The RSI has down sharply and currently just above the 50 level.
Major Support Level – $9.60
Major Resistance Level – $10.20
Charts courtesy – SimpleFX