Key Highlights
- ETH price remained in a downside category with support at $18.18 against the US Dollar.
- There is a bearish trend line with resistance at $18.70 formed on the hourly chart of ETH/USD (data feed via SimpleFX).
- There is a chance that the price may extend the downside leg and trade below $18.18.
Ethereum price failed to hold the $19.05 support against the US Dollar, increasing the risk of more losses in ETH/USD in the short term.
Ethereum Price Next Leg Lower?
Yesterday, we discussed how ETH price may be heading lower vs the US Dollar due to a break below $19.50. The price did trade lower, and managed to break the $19.05 support as well. The most important break was below $18.79, representing the 61.8% Fib retracement level of the recent move from the $18.05 low to $19.99 high. It increased the bearish pressure, and the price was seen trading below $18.50.
There was even a proper close below the 100 simple moving average at $19.09. These all are negative sign. It looks like the price is set to test the recent low of $18.18. And, if there is an increase in the bearish pressure, the price could even break it for a move towards $18.00. On the upside, there is a bearish trend line with resistance at $18.70 formed on the hourly chart (ETH/USD, data feed via SimpleFX). It also coincides with the 23.6% Fib retracement level of the last drop from the $20.03 high to $18.18 low.
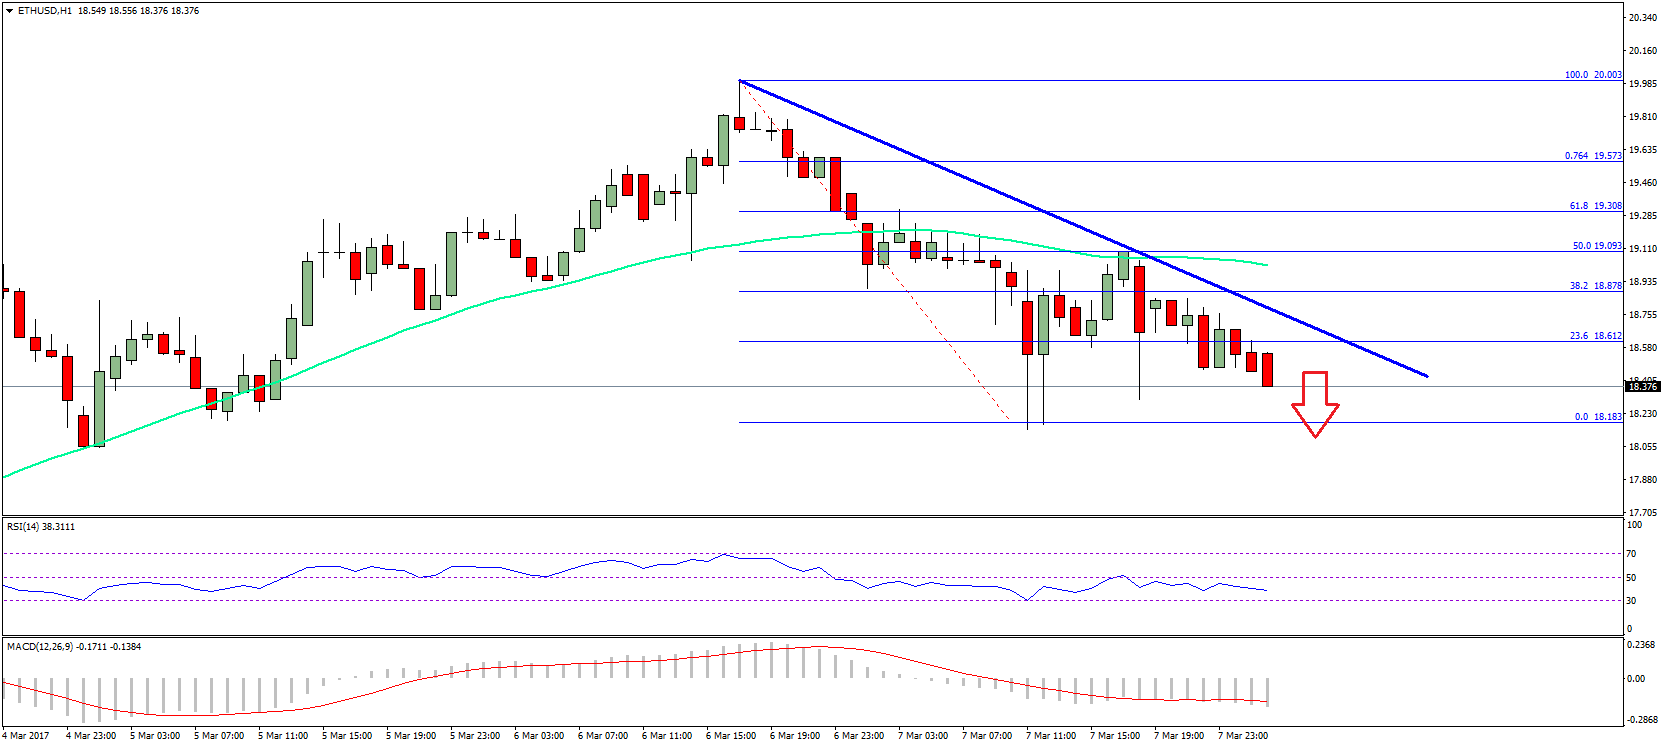
So, if the price corrects higher it may face sellers near the trend line resistance at $18.60. Furthermore, the 100 hourly SMA is also a hurdle on the upside near $19.08 for the ETH buyers.
Hourly MACD – The MACD is now in the bearish zone, suggesting a decline.
Hourly RSI – The RSI is heading lower, and remains well below the 50 level.
Major Support Level – $18.00
Major Resistance Level – $19.60
Charts courtesy – SimpleFX