Key Highlights
- There were further gains in ETH price, as it moved above the $175 level against the US Dollar before starting a correction.
- There was a break below a bullish trend line at $159 on the hourly chart (ETH/USD, data feed via SimpleFX).
- The price is currently below the $158 resistance, and may extend the correction.
Ethereum price overcame sellers against the US Dollar and Bitcoin, and now ETH/USD is forming a short-term correction pattern below $158.
Ethereum Price Trend Line Break
Yesterday, I mentioned that ETH price remains bullish any may spike towards $160 or even $175 against the US Dollar. The price moved higher and traded above $175 to establish a new high at $182.03. Later, the price started a correction, and moved below the $165 support. To initiate the downside, there was a break below the 23.6% Fib retracement level of the last wave from the $122.35 low to $182.03 high.
However, the most important move was a break below a bullish trend line at $159 on the hourly chart of ETH/USD. The downside move was such that the price also broke the 50% Fib retracement level of the last wave from the $122.35 low to $182.03 high. It traded below $150 and formed a low at $136.43. The stated low represents the 76.4% Fib retracement level of the last wave from the $122.35 low to $182.03 high.
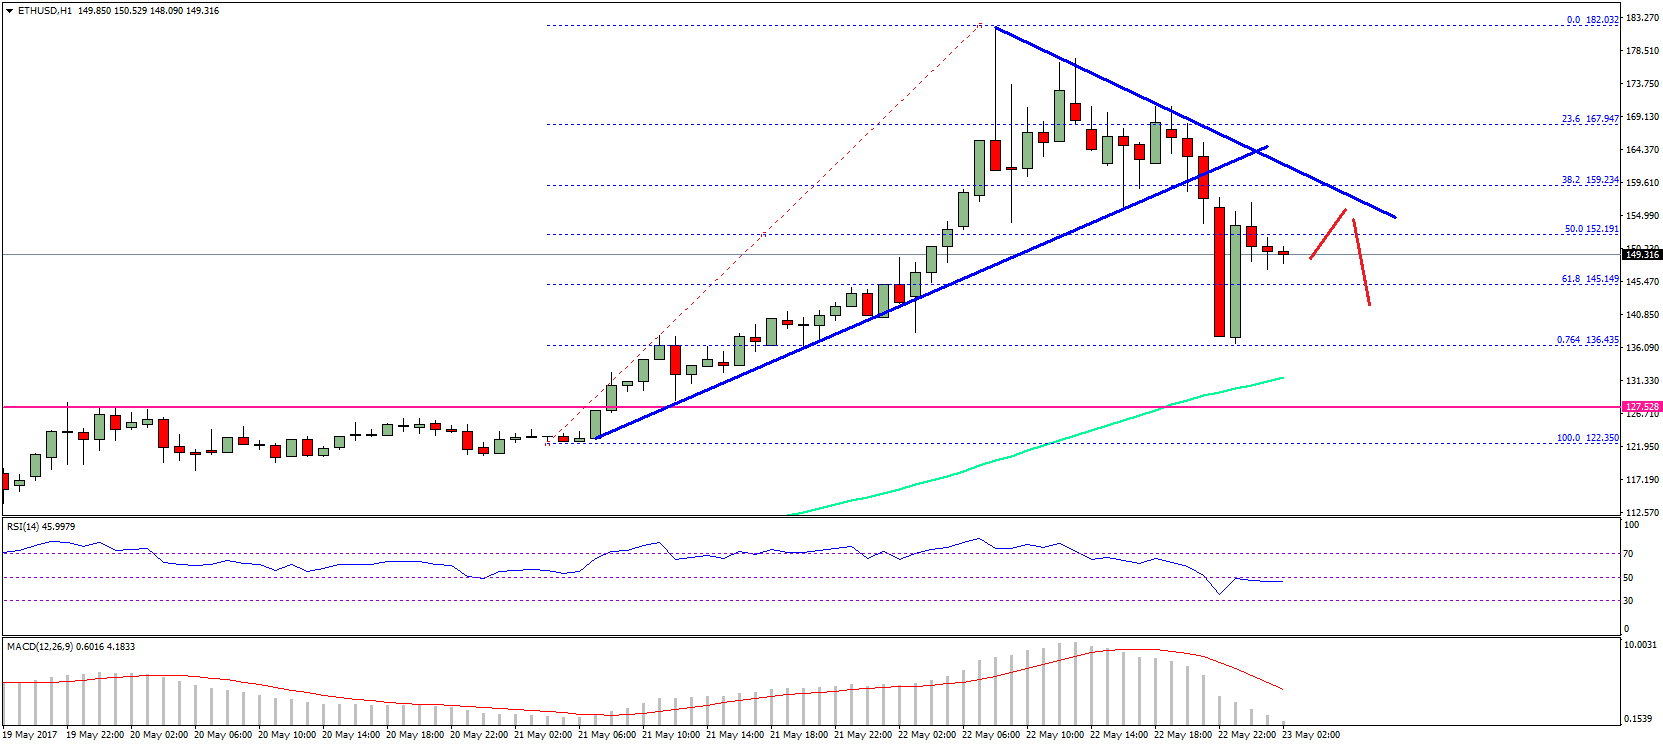
The price bounced back sharply, and currently above $145. There can be a few swing moves, but on the upside, there is a trend line resistance at $158. As long as the price is below $158-160, there can be another dip in the short term. On the downside, the $140 and $135 levels are decent supports.
Hourly MACD – The MACD has reduced all its bullish slope.
Hourly RSI – The RSI is just below the 50 level, and remains flat.
Major Support Level – $140.00
Major Resistance Level – $158.00
Charts courtesy – SimpleFX