Key Highlights
- ETH price is slowly preparing for the next move and placed well above $291.50 against the US Dollar.
- There is a major contracting triangle forming with resistance at $301.50 on the hourly chart of ETH/USD (data feed via SimpleFX).
- The price has to clear the $301-302 resistance to gain traction in the near term.
Ethereum price is slowly recovering against the US Dollar and Bitcoin. ETH/USD needs to clear the $301-302 area for more gains in the near term.
Ethereum Price Resistance
There were a couple of tiny swing moves in ETH price towards the $292-294 support zone against the US Dollar. The downside reaction was mostly supported by the $292 level and the price remains range bound. It seems like there is a major contracting triangle forming with resistance at $301.50 on the hourly chart of ETH/USD. The pair recently tested the triangle resistance near $302.60 and declined back towards $295.
A low was formed at $294.15 and the price was able to gather bids to move above the 100 hourly simple moving average. It has moved above the 23.6% Fib retracement level of the last decline from the $302.62 high to $294.15 low. The current price action is positive, and it seems like the price might soon test the 61.8% Fib retracement level of the last decline from the $302.62 high to $294.15 low. However, the upside move is likely to be capped by $300-301.
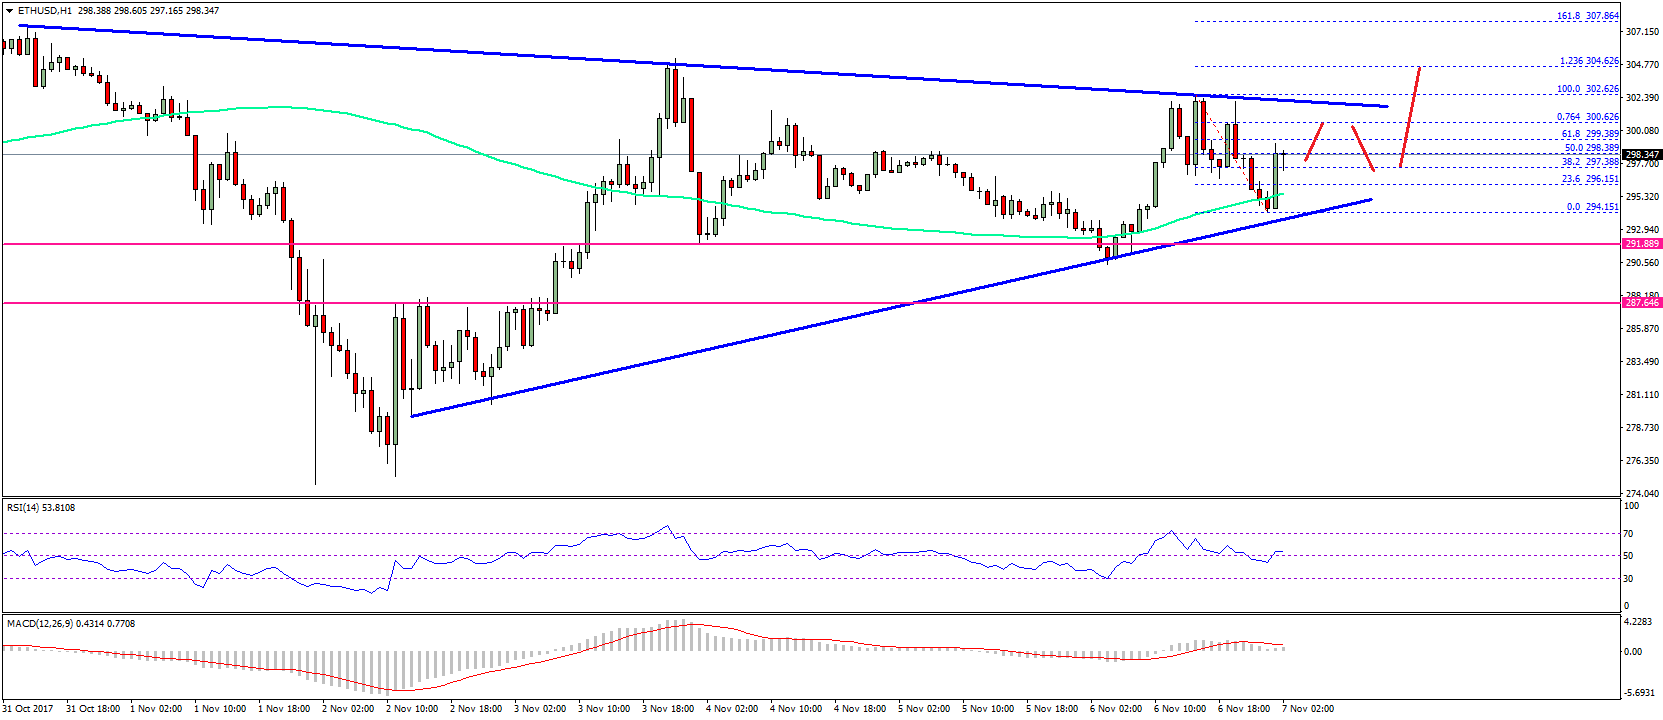
A proper break above the triangle resistance at $301.50-302.00 is required for more gains in the near term. Until there is a break, ETH might continue to move inside a range above $292. On the upside, the $309-310 remains a major hurdle for buyers in the medium term.
Hourly MACD – The MACD is not showing any major bullish signs.
Hourly RSI – The RSI is currently just above the 50 level with bullish angle.
Major Support Level – $292
Major Resistance Level – $302
Charts courtesy – SimpleFX
SaveSave