Key Highlights
- ETH price traded a touch lower against the US Dollar, and closed below the $9.50 support area.
- Yesterday’s ascending channel pattern on the hourly chart (data feed via SimpleFX) of ETH/USD was broken to clear the way for more downsides.
- There is a bearish trend line on the same chart, acting as a resistance near $9.45.
Ethereum price is currently moving down against the US Dollar, and it looks like the ETH/USD pair is slowly moving into the bearish zone.
Ethereum Price Resistance
Yesterday, we saw how ETH price was trading in an ascending channel against the US Dollar. However, the price failed to hold the support area, and moved down below $9.50. The most important point was the fact that the price also broke the ascending channel pattern on the hourly chart (data feed via SimpleFX) of ETH/USD. It opened the doors for a downside move towards the $9.35 level.
If we consider the wave count correctly, the price failed to break the 50% Fib retracement level of the last decline from the $10.58 high to $9.00 low. Later, there was a consolidation channel pattern formed, which was a broken yesterday. So, it looks like the price may trade down further and head towards $9.20. Another point is that the price has moved below the 100 hourly simple moving average.
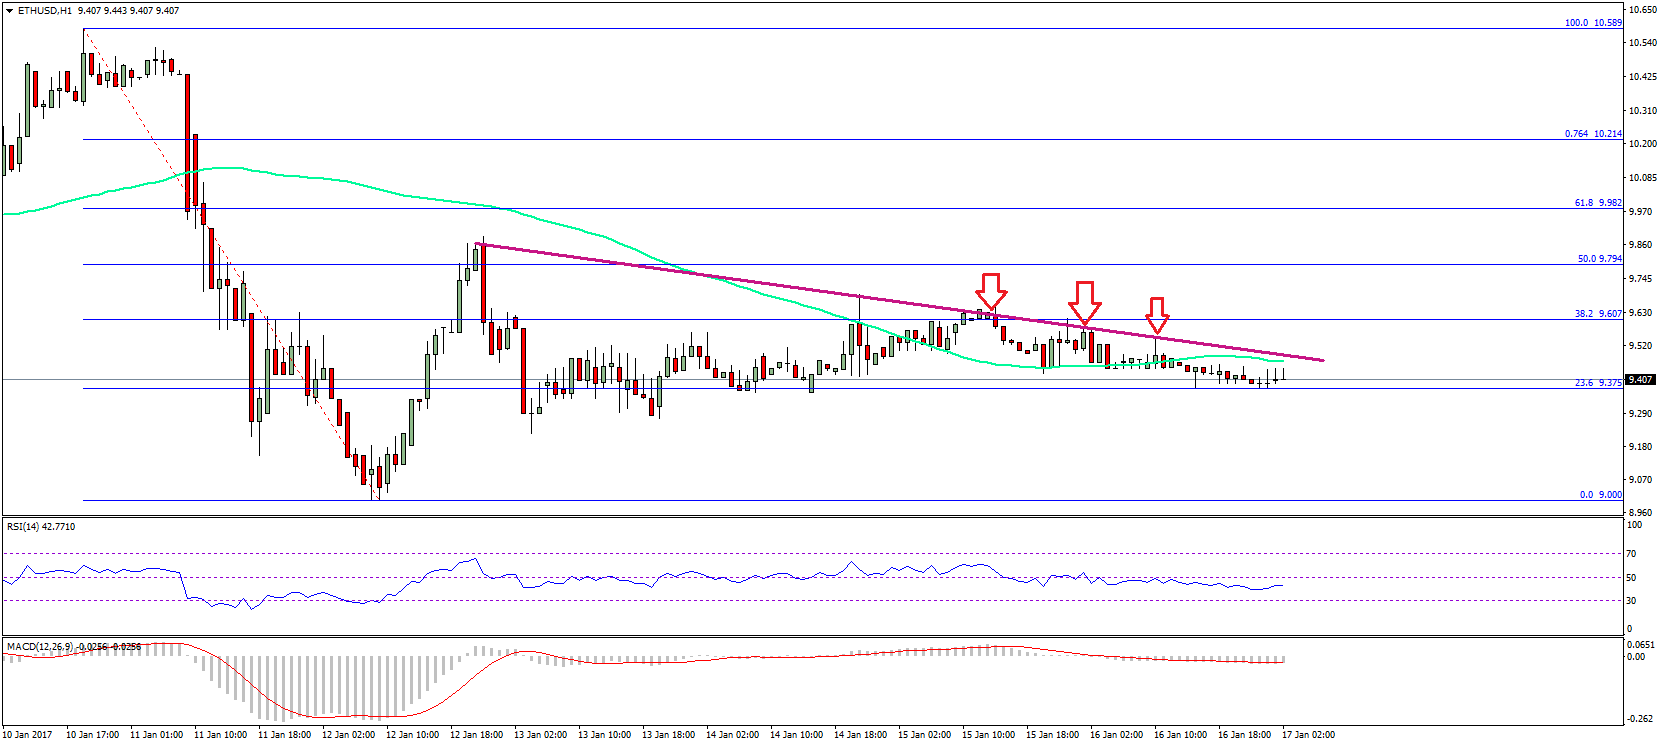
So, there are high chances of sellers taking control in the short term for a downside move. On the upside, there is a bearish trend line on the same hourly chart, which is acting as a resistance near $9.45. Overall, the price is currently under a resistance, and may trade down in the near term.
Hourly MACD – The MACD is in the bearish zone, but it is not showing any major movement.
Hourly RSI – The RSI has moved below the 50 level with a negative bias.
Major Support Level – $9.20
Major Resistance Level – $9.50
Charts courtesy – SimpleFX