Key Highlights
- ETH price gained pace and moved above the $300 barrier against the US Dollar.
- There is a new connecting bullish trend line forming with support at $294 on the hourly chart of ETH/USD (data feed via SimpleFX).
- The price is currently correcting lower, but remains supported on the downside.
Ethereum price is back in the bullish zone against the US Dollar and Bitcoin. ETH/USD is now a good buy near the $300-294 levels in the near term.
Ethereum Price Support
It was a good period for ETH price as it moved above the $300 barrier against the US Dollar. Before the upside move, there was a minor dip towards the 50% Fib retracement level of the last wave from the $275.00 low to $295.50 high. Buyers appeared around $285-288 and protected declines. As a result, there was an upside move above the $294-295 resistance levels.
The upside move was strong enough to take out the $300 barrier. It traded as high as $311.45 and is currently correcting lower. The price has breached the 23.6% Fib retracement level of the last wave from the $285.16 low to $311.45 high. There is a new connecting bullish trend line forming with support at $294 on the hourly chart of ETH/USD. Before the trend line support, the 50% Fib retracement level of the last wave from the $285.16 low to $311.45 high is near $298.31.
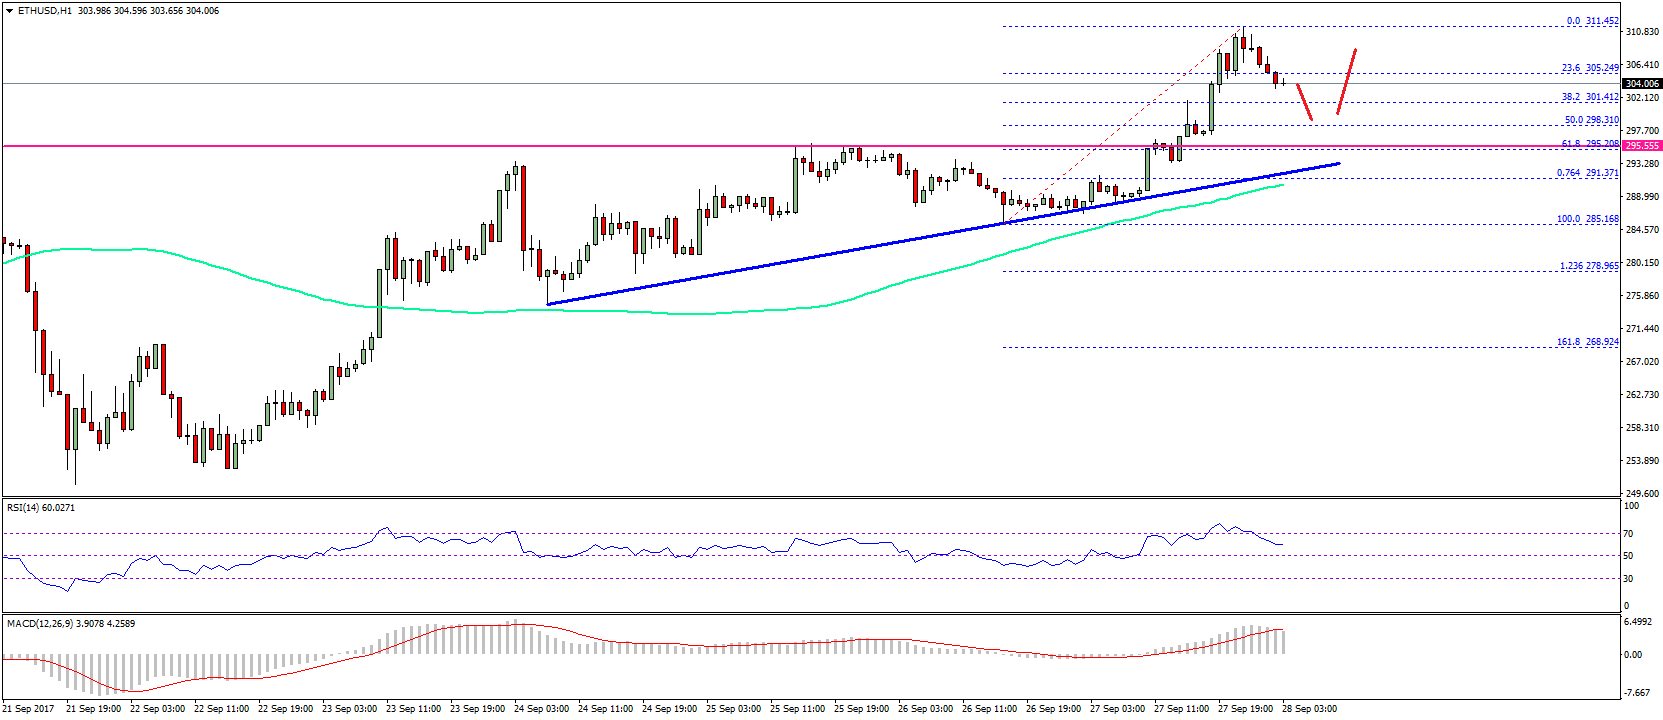
Overall, the price remains supported on the downside above $295. Not to forget, the mentioned $295 level was a resistance earlier and now it could act as a support. Buying dips towards $298-295 can be considered as long as there is no close below $290. On the upside, an initial resistance is at $311 followed by the $315 level.
Hourly MACD – The MACD is placed well in the bullish zone.
Hourly RSI – The RSI is moving down towards the 50 level.
Major Support Level – $295
Major Resistance Level – $315
Charts courtesy – SimpleFX