Key Highlights
- ETH price failed to gain pace above $940 and declined sharply against the US Dollar.
- There was a break below a major bullish trend line with support at $925 on the hourly chart of ETH/USD (data feed via SimpleFX).
- The pair is now trading below the $900 level and it seems like the price may struggle to correct higher.
Ethereum price declined sharply against the US Dollar and Bitcoin. ETH/USD may correct a few points from the current levels, but upsides remain capped.
Ethereum Price Resistance
There was no upside break in ETH price above the $940 resistance level against the US Dollar. It resulted in a downside reaction and the price declined sharply below $900. It even moved below the $880 support and settled below the 100 hourly simple moving average. There are many bearish signs visible on the charts below the $900 level. The recent low formed was $848 from where the price started an upside correction.
During the downside move, there was a break below a major bullish trend line with support at $925 on the hourly chart of ETH/USD. The pair traded above the 23.6% Fib retracement level of the last decline from the $948 high to $848 low. However, the upside move seems to be limited as the price is facing sellers near $895. On the upside, the 50% Fib retracement level of the last decline from the $948 high to $848 low is likely to act as a resistance. Moreover, there is also a bearish trend line on the same chart with resistance at $900.
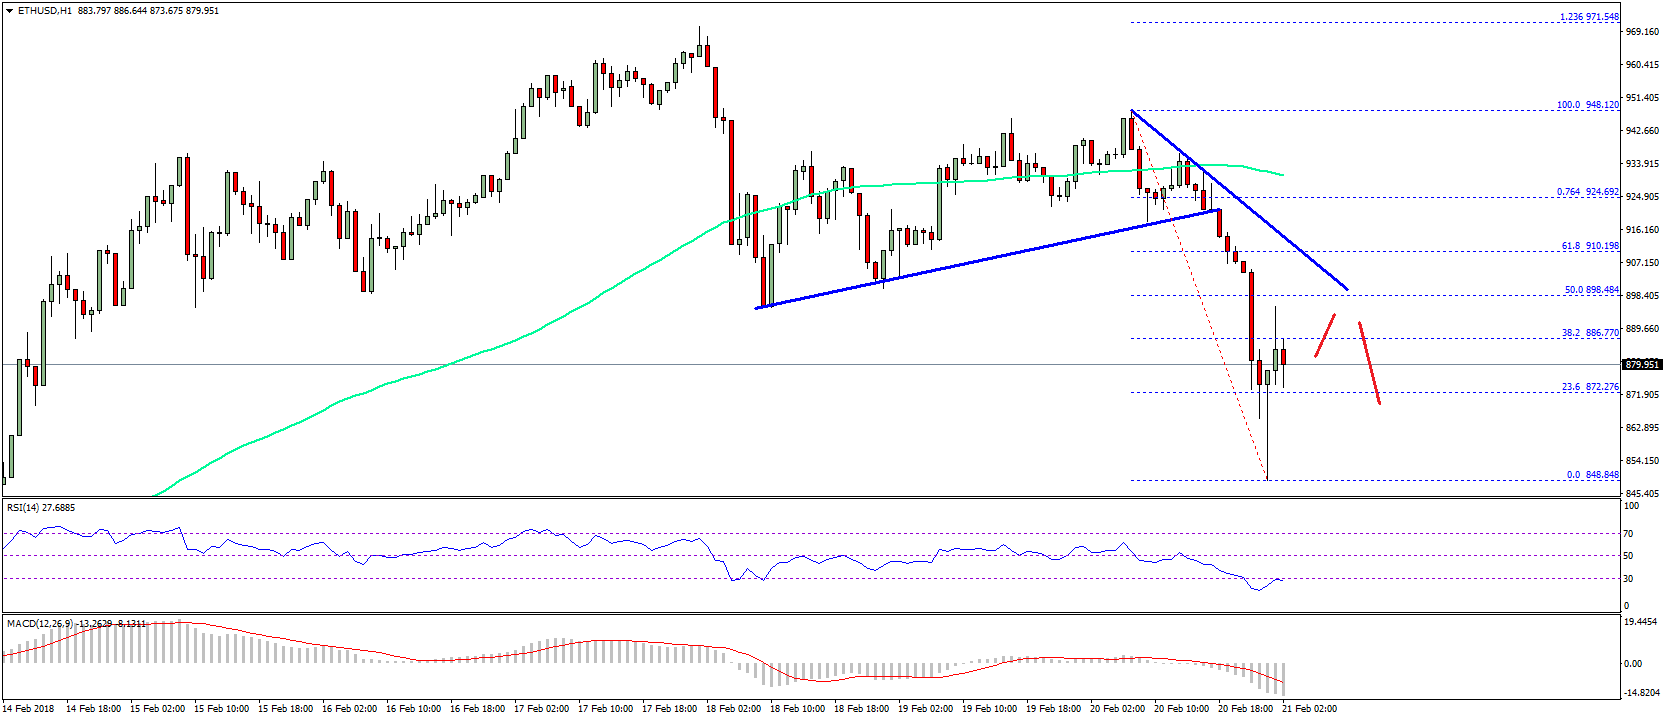

Therefore, it seems like the price may struggle to correct further above $890-900. On the downside, the $840-850 area is a major support in the short term.
Hourly MACD – The MACD is placed strongly in the bearish zone.
Hourly RSI – The RSI is attempting a small recovery from the oversold levels.
Major Support Level – $850
Major Resistance Level – $900
Charts courtesy – SimpleFX