Key Highlights
- ETH price is slowly moving higher and it is currently trading above the $520 support against the US Dollar.
- Yesterday’s highlighted major bearish trend line with resistance at $535 was broken on the hourly chart of ETH/USD (data feed via Kraken).
- The pair is now facing a major resistance near $560 and the 100 hourly simple moving average.
Ethereum price is in a recovery mode against the US Dollar and Bitcoin. ETH/USD must breach the 100 hourly SMA to continue its upside momentum.
Ethereum Price Resistance
There was a decent upside move in ETH price from the $480 swing low against the US Dollar. The price traded higher and recovered above the $500 and $520 resistance levels. The best part was a close above the 50% Fib retracement level of the last drop from the $610 swing high to $454 low. It seems like the price is now trading in a positive zone above the $520 level.
During the upside move, yesterday’s highlighted major bearish trend line with resistance at $535 was broken on the hourly chart of ETH/USD. At the moment, the pair is struggling to break the $560 resistance and the 100 hourly simple moving average. Moreover, a close above the 61.8% Fib retracement level of the last drop from the $610 swing high to $454 low is needed for buyers to take control in the near term. Once the price succeeds in breaking the $560 resistance and the $570 barrier, it could easily move above the $600 level.
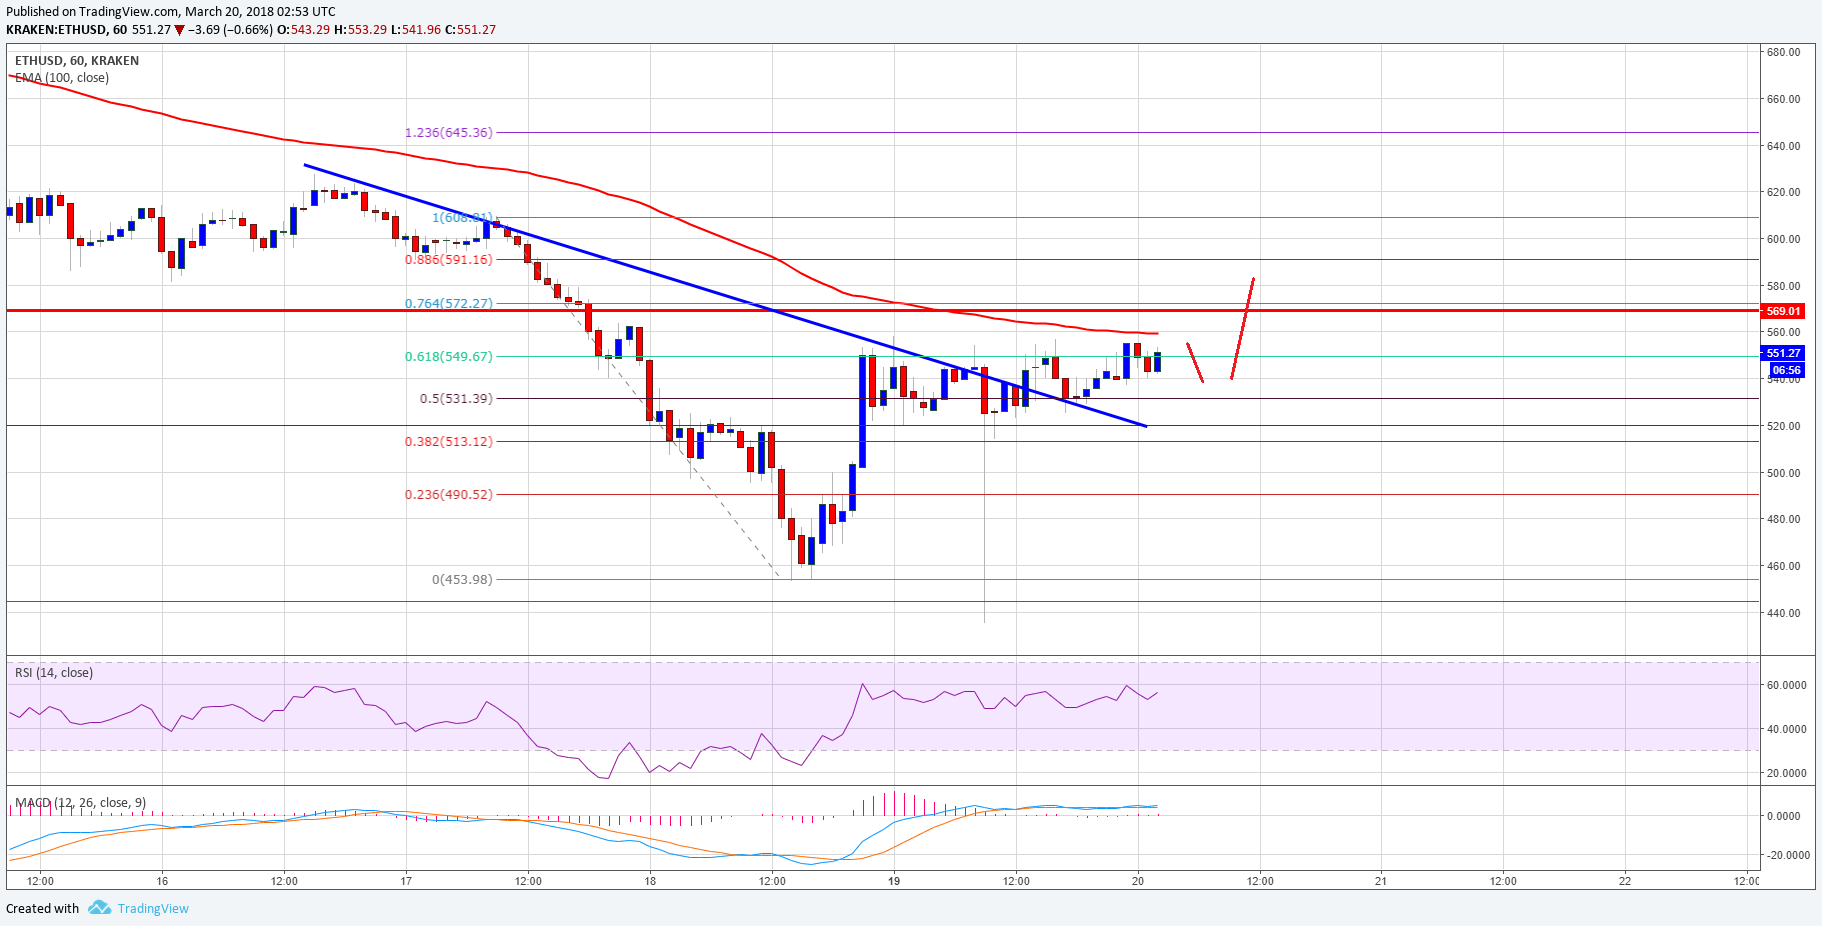

On the downside, there is a decent support forming near $520. Below $520, the $500 level is a short-term support. ETH price has to stay above the $500 level if it has to move higher above $560 in the near term.
Hourly MACD – The MACD is currently flat in the bullish zone.
Hourly RSI – The RSI is nicely placed above the 50 level.
Major Support Level – $520
Major Resistance Level – $560
Charts courtesy – Trading View