Key Highlights
- ETH price is currently consolidating losses with a slight bullish angle above $375 against the US Dollar.
- There is a major bearish trend line forming with resistance at $392 on the hourly chart of ETH/USD (data feed via Kraken).
- The pair has to move above the $395 resistance and the 100 hourly simple moving average to gain upside momentum.
Ethereum price is currently consolidating losses against the US Dollar and Bitcoin. ETH/USD must pierce the 100 hourly SMA to remain in a positive zone.
Ethereum Price Upside Barrier
There was a decent support formed above the $350 level in ETH price against the US Dollar. The price started an upside correction and traded above the $375 level. It also succeeded in moving past the 23.6% Fib retracement level of the last drop from the $465 high to $360 low. However, the upside wave is currently facing a major barrier near the $392-395 levels.
It seems like the 100 hourly simple moving average is acting as a key resistance near $395. Moreover, there is a major bearish trend line forming with resistance at $392 on the hourly chart of ETH/USD. Above the trend line resistance, the 38.2% Fib retracement level of the last drop from the $405 high to $360 low is near the $400 level. A break and close above the trend line resistance, $395 and the 100 hourly SMA may open the doors for more gains. The next resistance could be the 61.8% Fib retracement level of the last drop from the $405 high to $360 low at $425.
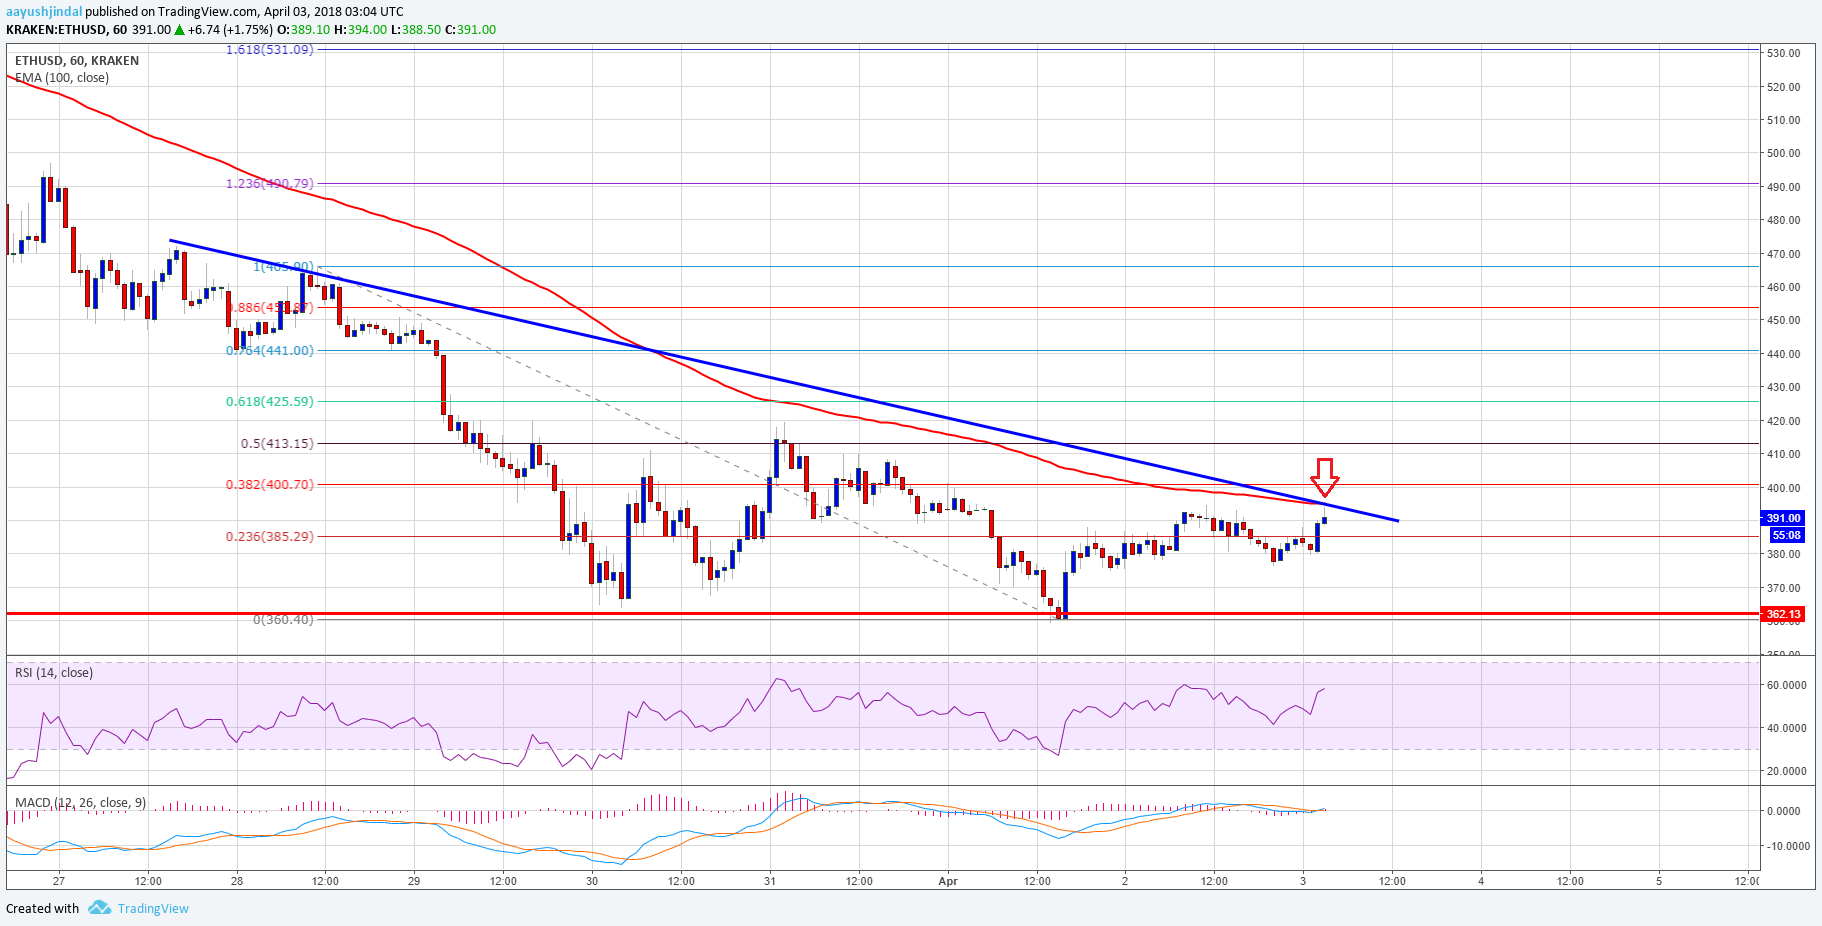

If the price fails to break the $395 resistance and 100 hourly SMA, there could be a downside reaction. In this case, the price could even break the $360.40 low for more declines in the near term.
Hourly MACD – The MACD could move back in the bullish zone.
Hourly RSI – The RSI is currently well above the 50 level.
Major Support Level – $360
Major Resistance Level – $395
Charts courtesy – Trading View