
Reason to trust
How Our News is Made
Strict editorial policy that focuses on accuracy, relevance, and impartiality
Ad discliamer
Morbi pretium leo et nisl aliquam mollis. Quisque arcu lorem, ultricies quis pellentesque nec, ullamcorper eu odio.
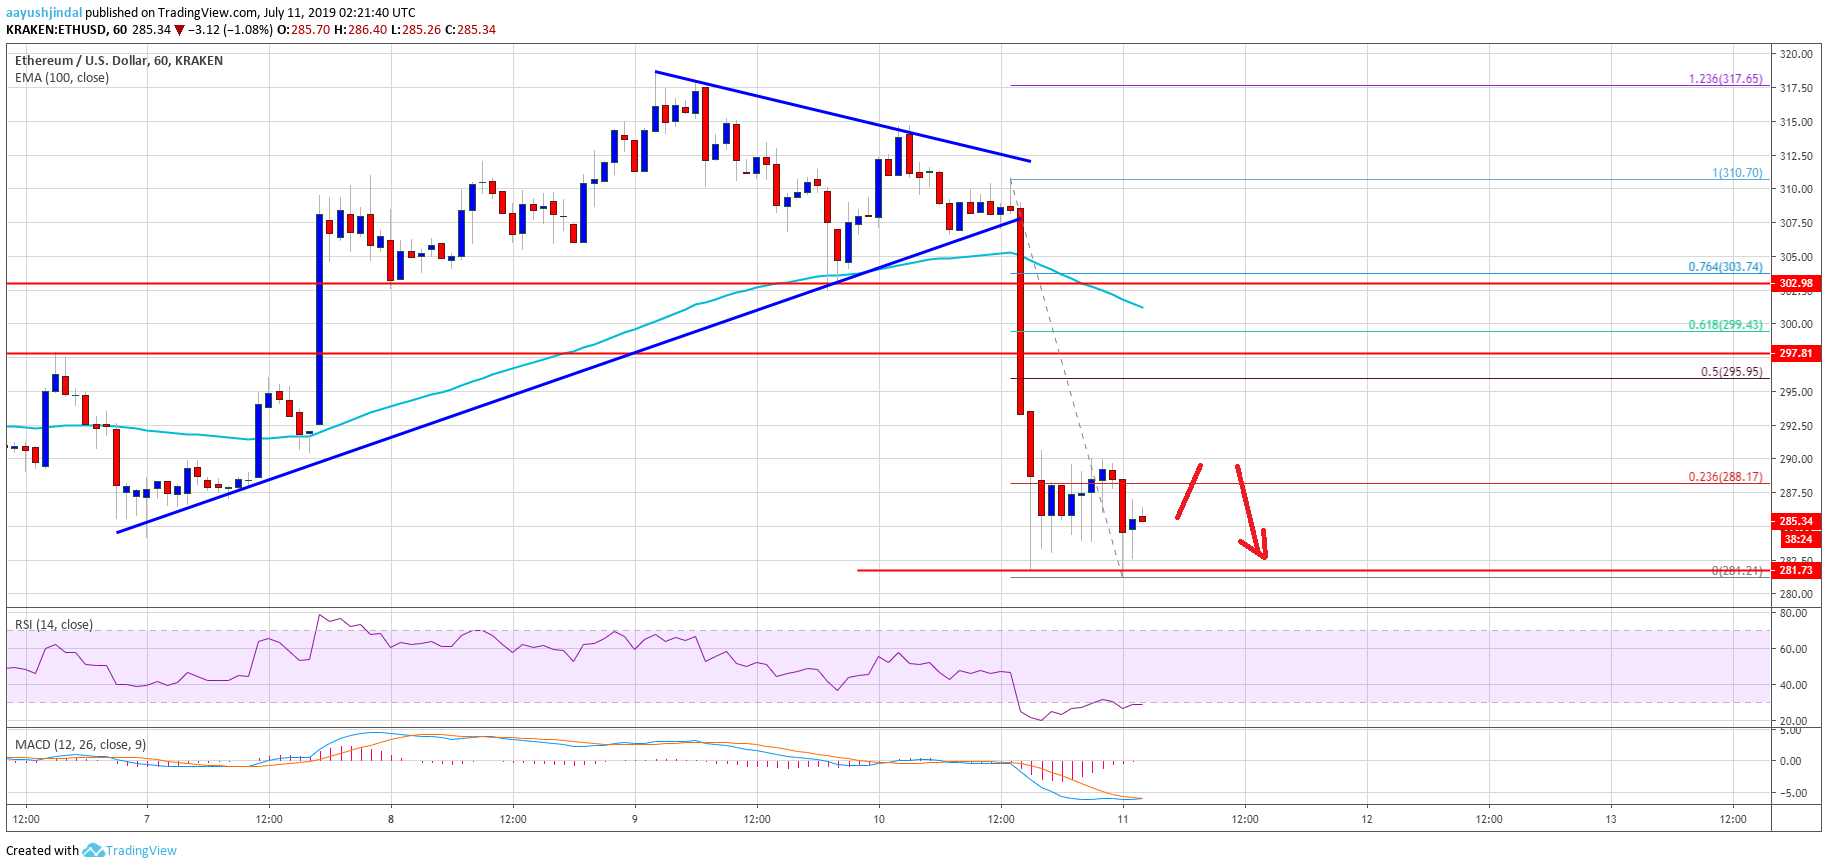
- ETH price failed to hold gains above the $310 level and recently declined heavily against the US Dollar.
- The price declined below the main $300 and $295 support levels to enter a bearish zone.
- There was a downside break below a contracting triangle with support at $308 on the hourly chart of ETH/USD (data feed via Kraken).
- The pair is now trading above the next major support near the $280 level.
Ethereum price declined sharply below the $300 support versus the US Dollar, along with bitcoin. ETH price could recover in the short term as long as it is above $280.
Ethereum Price Analysis
Recently, there was a sharp decline in bitcoin price below $12,500 against the US Dollar. BTC/USD even broke the $12,000 support level to register a 10% decline. It prompted a sharp decline in Ethereum as well below the $300 support area. Moreover, the ETH/USD pair declined below the $295 support level to move into a bearish zone. There was also a close below the $295 level and the 100 hourly simple moving average.
Besides, there was a downside break below a contracting triangle with support at $308 on the hourly chart of ETH/USD. A swing low was formed near $281 and the price is currently consolidating losses. An initial resistance is near the $288 level. It coincides with the 23.6% Fib retracement level of the recent decline from the $310 high to $281 swing low. If there is an upside correction, above $288, the price might recover above $290.
The next important resistance for the bulls is near the $295 level. Moreover, the 50% Fib retracement level of the recent decline from the $310 high to $281 swing low is also near the $295 level. Therefore, the bulls are likely to face a strong resistance near the $295 zone. A successful close above $295 might start a fresh increase towards the $310 and $315 levels.
On the downside, the main support is near the $280 level. If there is a downside break below the $280 support, the price could decline further towards the $270-272 support area.
Looking at the chart, Ethereum price seems to be struggling below the $290 level. In the short term, there could be an upside correction above the $290 level, but the price may struggle to clear the $295 zone. Conversely, if there is a break below $280, the price could move further into a bearish zone.
ETH Technical Indicators
Hourly MACD – The MACD for ETH/USD is slowly losing momentum in the bearish zone.
Hourly RSI – The RSI for ETH/USD is currently recovering from 20 and it could climb towards the 40 level.
Major Support Level – $280
Major Resistance Level – $295


