
Reason to trust
How Our News is Made
Strict editorial policy that focuses on accuracy, relevance, and impartiality
Ad discliamer
Morbi pretium leo et nisl aliquam mollis. Quisque arcu lorem, ultricies quis pellentesque nec, ullamcorper eu odio.
Ethereum failed to clear the $162 resistance and declined recently against the US Dollar. ETH price is now approaching the main $145 support, where the bulls might take a stand.
- Ethereum is showing a few bearish signs below the $155 and $162 resistance levels.
- A new monthly low is formed near $148 and the price is currently consolidating.
- There are two key bearish trend lines forming with resistance near $161 and $165 on the hourly chart of ETH/USD (data feed via SimpleFX).
- The bulls are likely to take a strong stand as long as the price is above $145 (as discussed in the weekly analysis).
Ethereum Price Facing Hurdles
Recently, Ethereum started a decent upward move from the $150 support area against the US Dollar. ETH price climbed above the $155 and $160 resistance levels.
However, the price faced a strong resistance near the $162 level and the 100 hourly simple moving average. There are also two key bearish trend lines forming with resistance near $161 and $165 on the hourly chart of ETH/USD.
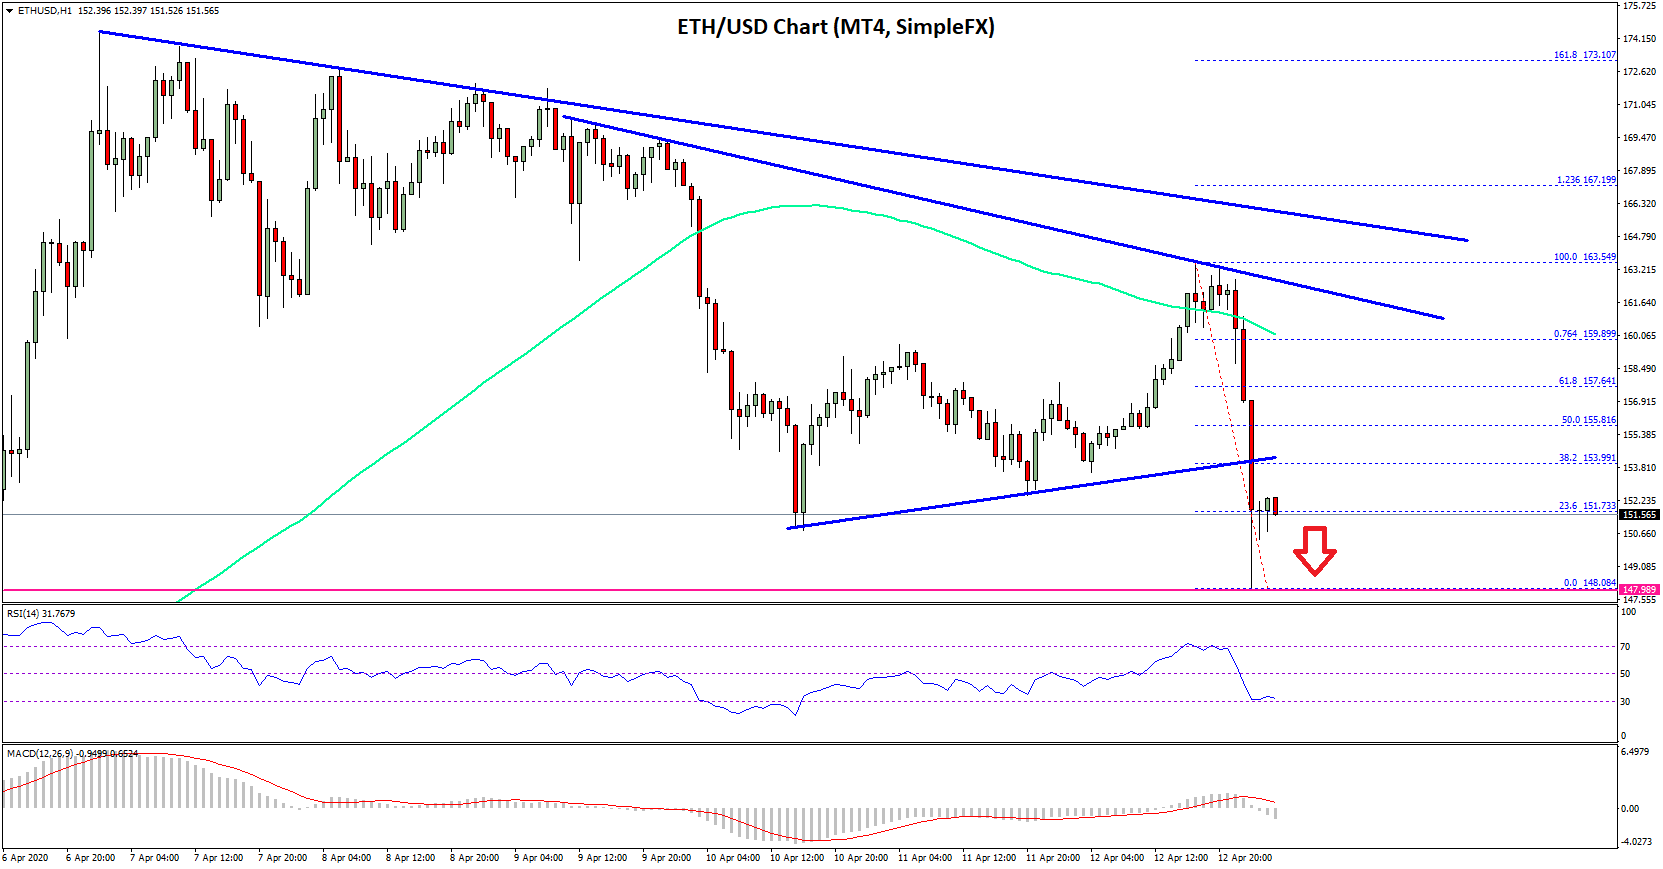
A swing high was formed near $163 and the price declined heavily. It seems like Ether was rejected above the $162 resistance and the 100 hourly SMA. The recent decline was such that the price even broke the $150 support and traded to a new monthly low at $148.
It is currently correcting higher and trading above $150. Besides, it is testing the 23.6% Fib retracement level of the recent decline from the $163 high to $148 low.
On the upside, an immediate resistance is near the $154-$155 zone. The 50% Fib retracement level of the recent decline from the $163 high to $148 low is also near the $155 level. The main resistance is still near the $162 level and the 100 hourly simple moving average.
A successful close above the $162 resistance zone is needed to start a strong increase in the coming sessions. The next major resistance is seen near the $168 and $170 levels.
$145 as a Key Buy Zone
On the downside, there is a major support waiting near the $145 area (as discussed in the weekly analysis). If there is a bearish break below the$145 support, the price could dive towards $120.
Conversely, the bulls are likely to aim a strong recovery wave above $162 as long as the price is above $145.
Technical Indicators
Hourly MACD – The MACD for ETH/USD is slowly moving in the bearish zone.
Hourly RSI – The RSI for ETH/USD is currently just above the 30 level.
Major Support Level – $145
Major Resistance Level – $155


