
Reason to trust
How Our News is Made
Strict editorial policy that focuses on accuracy, relevance, and impartiality
Ad discliamer
Morbi pretium leo et nisl aliquam mollis. Quisque arcu lorem, ultricies quis pellentesque nec, ullamcorper eu odio.
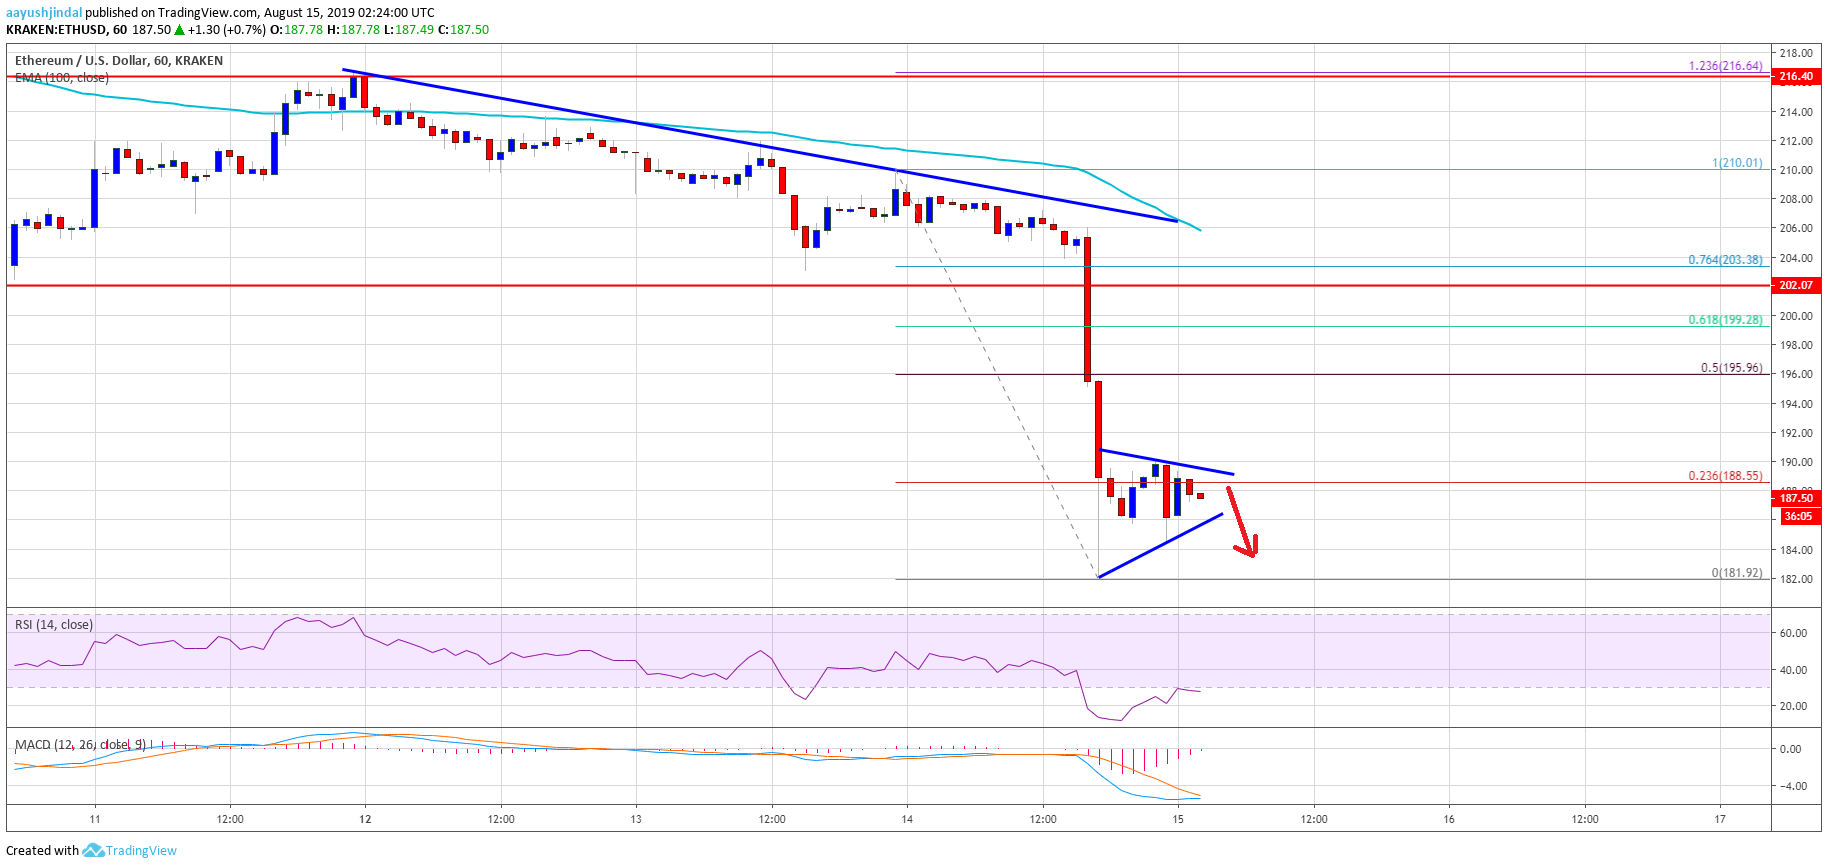
- ETH price started a strong decline after it failed to surpass the $210 resistance against the US Dollar.
- There was a break below the key $200 and $190 support levels.
- Yesterday’s highlighted key bearish trend line is intact with resistance near $206 on the hourly chart of ETH/USD (data feed via Kraken).
- The pair is currently consolidating losses above $185 and remains at a risk of more downsides.
Ethereum price is down more than 10% versus the US Dollar, following bitcoin price slide. ETH price is now trading in a bearish zone and it could even test the $180 level.
Ethereum Price Analysis
Yesterday, we saw a sharp decline in bitcoin price below the $11,000 support. However, ETH price remained stable above the $200 level. Later, BTC extended its decline below $200, which sparked a sharp selloff in Ethereum price. As a result, there was a break below the key $202 and $200 support levels against the US Dollar. More importantly, the price broke the $192 support and settled below the 100 hourly simple moving average.
A new weekly low was formed near $181 and the price is currently consolidating losses. It is trading near the $188 level plus the 23.6% Fib retracement level of the recent slide from the $210 high to $181 low. On the upside, there are many hurdles near the $192 and $195 levels. Moreover, the 50% Fib retracement level of the recent slide from the $210 high to $181 low is also near the $195 level.
The main resistance on the upside is near the $200 level (the previous support). The 61.8% Fib retracement level of the recent slide from the $210 high to $181 low is also near the $200 level. Finally, yesterday’s highlighted key bearish trend line is intact with resistance near $206 on the hourly chart of ETH/USD. Therefore, an upside correction is likely to face a strong selling interest near the $195 and $200 levels.
On the downside, an immediate support is near the $185 level, below which the price could revisit the $181 swing low. If there are more downsides, the price could even break the $180 support.
Looking at the chart, Ethereum price is trading in a major downtrend from well above $220. If it continues to slide, the chances of a strong bounce above $200 might decrease. The main supports on the downside are near $180, $178 and $175, where the bulls might take a stand.
ETH Technical Indicators
Hourly MACD – The MACD for ETH/USD is slowly reducing its bearish slope.
Hourly RSI – The RSI for ETH/USD is currently recovering from the oversold readings.
Major Support Level – $180
Major Resistance Level – $195


