
Reason to trust
How Our News is Made
Strict editorial policy that focuses on accuracy, relevance, and impartiality
Ad discliamer
Morbi pretium leo et nisl aliquam mollis. Quisque arcu lorem, ultricies quis pellentesque nec, ullamcorper eu odio.
- ETH price declined heavily and broke the $220 and $210 support levels against the US Dollar.
- The price is down around 15% and it even broke the $200 support area to move into a bearish zone.
- There is a key bearish trend line forming with resistance near $210 on the hourly chart of ETH/USD (data feed via Kraken).
- The pair is likely to slide further below the $192 and $190 support levels in the near term.
Ethereum price is declining heavily and is already down more than 15% versus the US Dollar, similar to bitcoin. ETH price could continue to slide if it breaks the $190 support area.
Ethereum Price Analysis
After a short term upside correction, Ethereum price failed to gain traction above $235 against the US Dollar. ETH/USD started a fresh decline and broke a couple of important supports near the $225 and $220 levels. More importantly, bitcoin price failed near $11,000 and recently declined more than $1,000. The current price action is very bearish and it seems like ETH could continue to dive below the $200 support level.
During the recent slide, there was a break below a major ascending channel with support near $230 on the hourly chart of ETH/USD. It opened the doors for a fresh decline below the $220 and $210 levels. Moreover, there was a break below the $200 support and the price settled well below the 100 hourly simple moving average. A new monthly low was formed near the $190 level and the price is still trading with a bearish angle.
An immediate resistance is near the $200 level plus the 23.6% Fib retracement level of the recent drop from the $235 high to $190 low. Moreover, there is a key bearish trend line forming with resistance near $210 on the same chart. The 50% Fib retracement level of the recent drop from the $235 high to $190 low is also near the $213 level to act as a strong resistance in the near term.
On the downside, an immediate support is near the $192 and $190 levels. If there is a downside break below the $190 support, the price may test the $185 support. The main support for the bulls is near the $180 level.
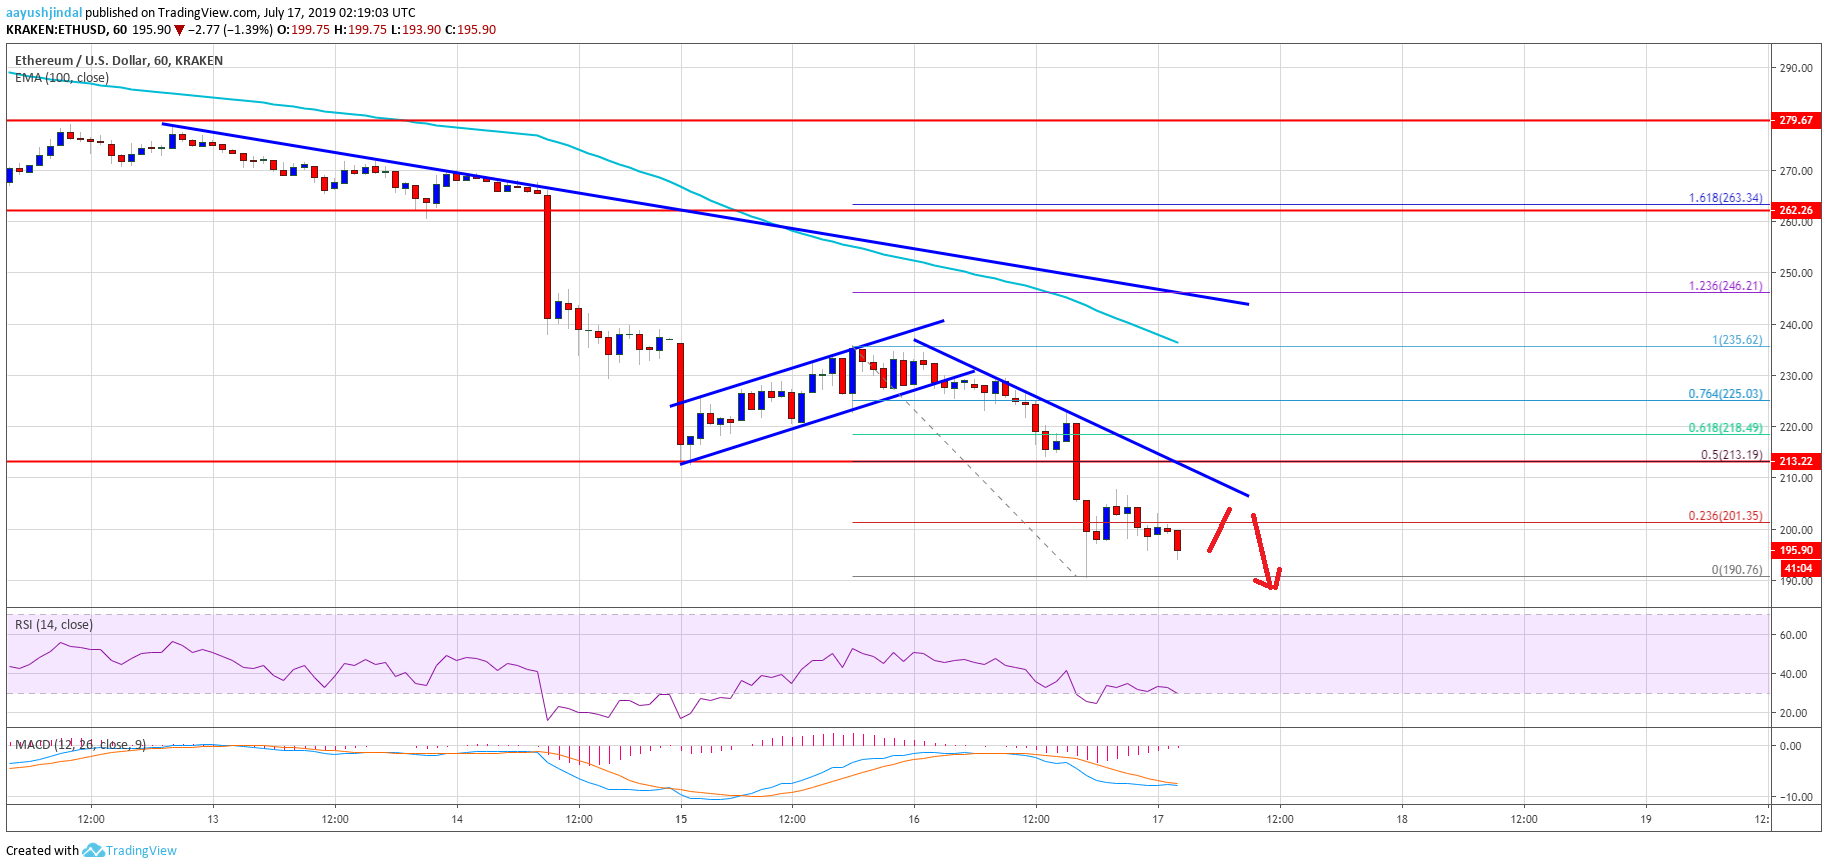
Looking at the chart, Ethereum price is under a lot of pressure below $200, while bitcoin price dived below $9,500. Therefore, there could be more downsides below the $190 level in the near term.
ETH Technical Indicators
Hourly MACD – The MACD for ETH/USD is currently showing negative signs in the bearish zone.
Hourly RSI – The RSI for ETH/USD declined heavily and it is now well below the 40 level.
Major Support Level – $190
Major Resistance Level – $213


