
Reason to trust
How Our News is Made
Strict editorial policy that focuses on accuracy, relevance, and impartiality
Ad discliamer
Morbi pretium leo et nisl aliquam mollis. Quisque arcu lorem, ultricies quis pellentesque nec, ullamcorper eu odio.
Ethereum is currently correcting higher from the $148 monthly low against the US Dollar. ETH price is now facing a couple of key hurdles near the $158, $162 and $164 levels.
- Ethereum is slowly recovering higher after trading as low as $148.
- The price is trading above the $152 level, but the bulls are facing a lot of hurdles.
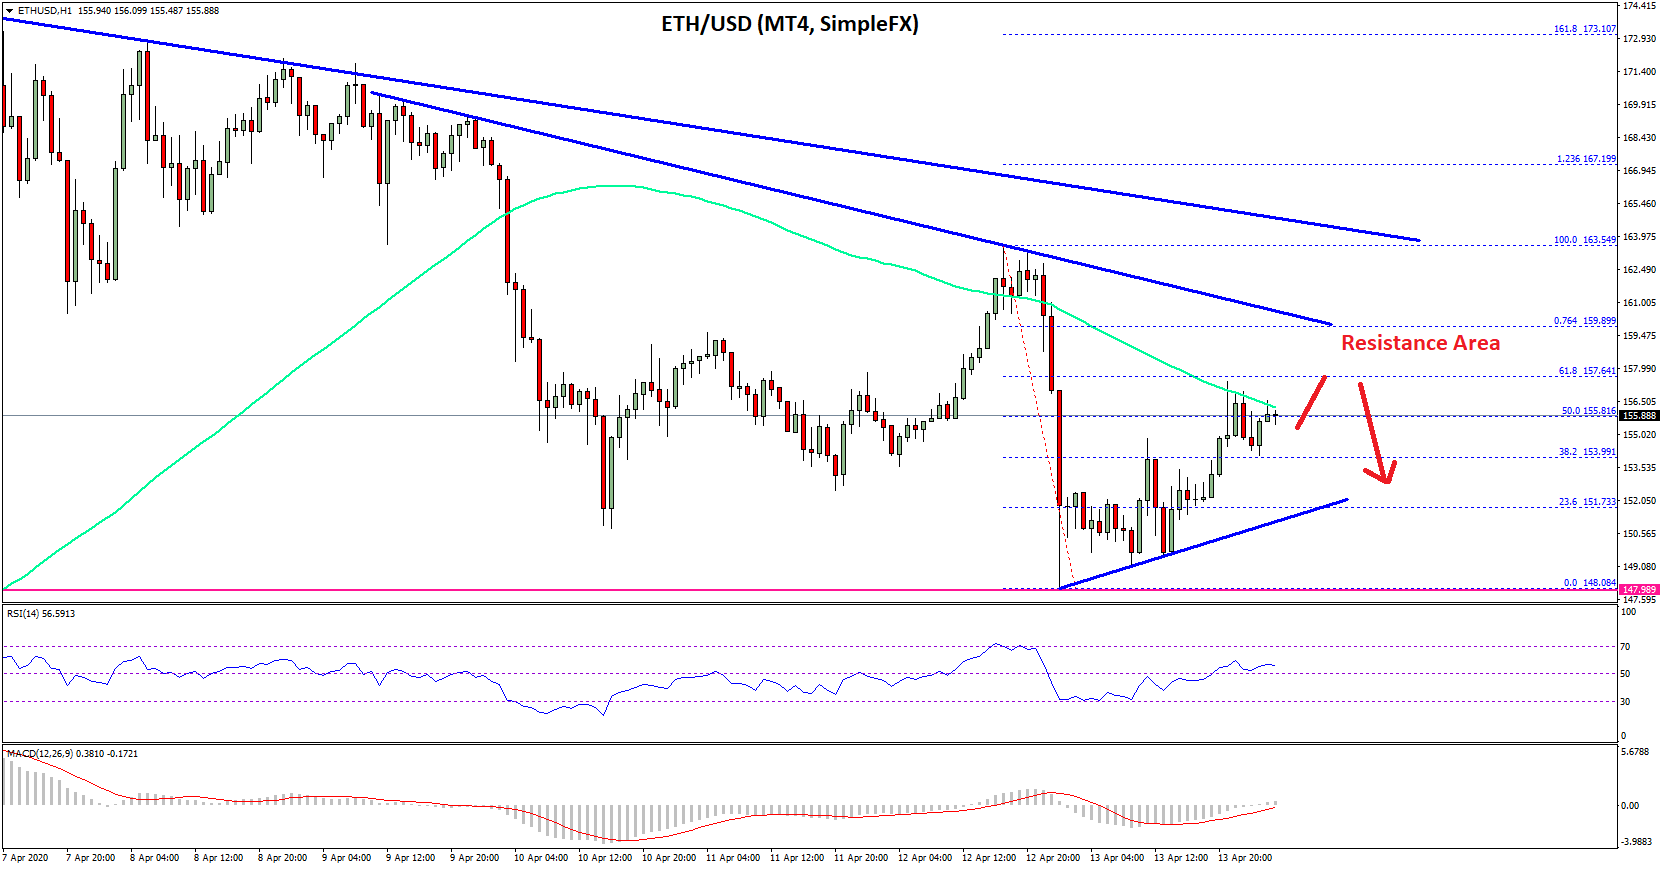
- Yesterday’s followed two bearish trend lines are active with resistance near $160 and $164 on the hourly chart of ETH/USD (data feed via SimpleFX).
- The pair could only turn bullish once it clears the $164 resistance and settle above $165.
Ethereum Price Testing 100 Hourly SMA
After settling below the $160 level, Ethereum started a fresh bearish wave against the US Dollar. ETH price broke the $155 support to move further into a short term bearish zone.
Besides, there was a break below the $150 level and settled below the 100 hourly simple moving average. The price traded to a new monthly low at $148 and it is currently correcting higher.
It broke the $152 resistance level to start a correction. Ethereum surpassed the 50% Fib retracement level of the key drop from the $164 swing high to $148 low. However, the price is now facing a couple of hurdles near the $156-$157 area.
The 61.8% Fib retracement level of the key drop from the $164 swing high to $148 low is also likely to act as a key hurdle. More importantly, yesterday’s followed two bearish trend lines are active with resistance near $160 and $164 on the hourly chart of ETH/USD.
If there is a break above the 100 hourly SMA, the price might test the upper trend line. A successful close above the $164 and $165 resistance levels is needed for a clear direction. The next key resistance is near the $175 level. Any further gains could lead the price towards the $185 and $188 levels.
Dips Supported?
If Ethereum fails to continue above the 100 hourly SMA or the $160 resistance, there are chances of another bearish reaction. On the downside, an initial support is near the $152 level and a connecting bullish trend line on the same chart.
There is also a key support forming near the $145 area (as discussed in the weekly analysis). If the bulls fail to hold the $145 support area, there is a risk of more losses towards the $132 and $130 levels.
Technical Indicators
Hourly MACD – The MACD for ETH/USD is slowly moving into the bullish zone.
Hourly RSI – The RSI for ETH/USD is currently rising and it is above the 50 level.
Major Support Level – $152
Major Resistance Level – $160
Image from unsplash


