
Reason to trust
How Our News is Made
Strict editorial policy that focuses on accuracy, relevance, and impartiality
Ad discliamer
Morbi pretium leo et nisl aliquam mollis. Quisque arcu lorem, ultricies quis pellentesque nec, ullamcorper eu odio.
- ETH price tumbled after it failed to break the $165 and $166 resistance levels against the US Dollar.
- The price declined and broke the $160, $152 and $140 support levels to move into a bearish zone.
- There was a break below a major bullish trend line with support at $148 on the hourly chart of ETH/USD (data feed via Kraken).
- The pair is now trading in a bearish zone below the $140, $144 and $148 resistance levels.
Ethereum price made a sharp U-turn against the US Dollar and bitcoin. ETH/USD broke key supports near $148 and $142 to enter a short-term bearish zone, with a negative angle.
Ethereum Price Analysis
This past week, we saw a nasty upward move above the $140 and $150 resistances in ETH price against the US Dollar. The ETH/USD pair even climbed above the $160 resistance to stage a solid comeback. It traded close to the $166 resistance level, where sellers emerged. More importantly, there was a strong rejection noted near the $165 and $166 resistance levels. The price formed a topping pattern and later started a sharp decline below the $160 support level.
The decline was such that the price failed to stay above the $152 and $150 support levels. There was a break below a major bullish trend line with support at $148 on the hourly chart of ETH/USD. The pair even settled below the $150 level and the 100 hourly simple moving average. Finally, there was a break below the key $138 and $140 support levels. It opened the doors for more losses and the price traded towards the $130 support. A low was formed at $131 and the price is currently correcting higher.
An initial resistance is near the 23.6% Fib retracement level of the last decline from the $166 high to $131 low. It seems like the previous support area near the $140 level is likely to act as a strong resistance for buyers. On the upside, the next main resistance is near the $148 level and the 100 hourly SMA. The 50% Fib retracement level of the last decline from the $166 high to $131 low is also positioned near the $148 level.
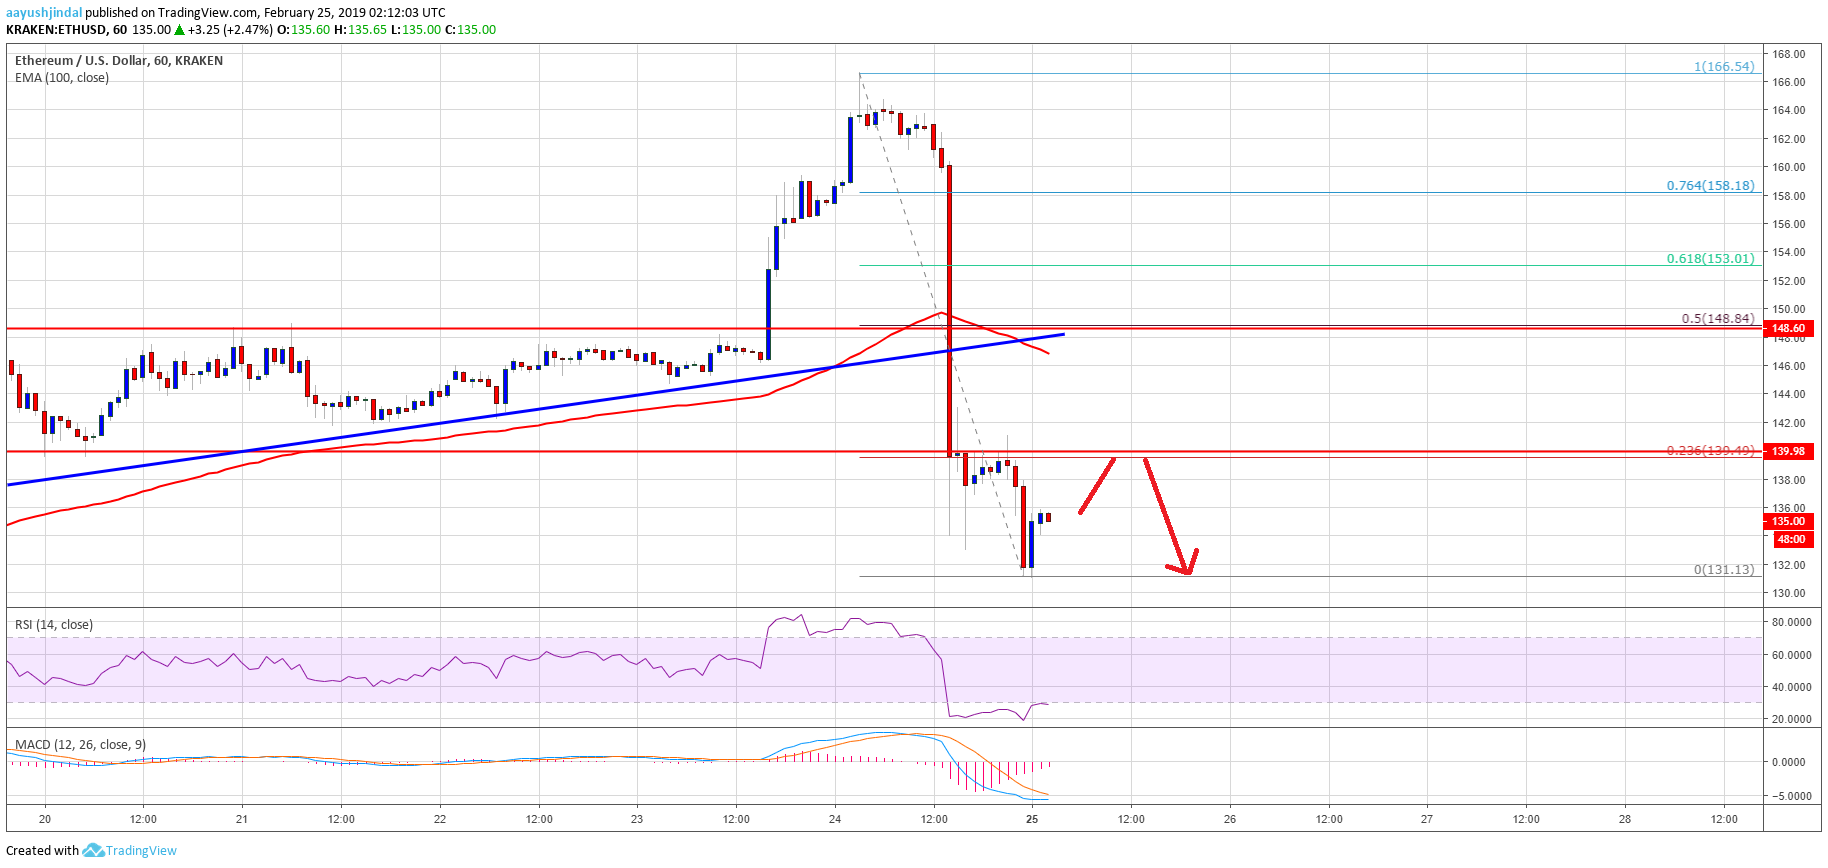
Looking at the chart, ETH price clearly moved into a short term bearish zone below $148 and $140. If there is an upside correction, sellers are likely to defend the $138 and $140 levels.
ETH Technical Indicators
Hourly MACD – The MACD for ETH/USD is about to move back in the bullish zone, with positive signs.
Hourly RSI – The RSI for ETH/USD is currently recovering from the oversold levels, but it is still below the 40 level.
Major Support Level – $130
Major Resistance Level – $140


