
Reason to trust
How Our News is Made
Strict editorial policy that focuses on accuracy, relevance, and impartiality
Ad discliamer
Morbi pretium leo et nisl aliquam mollis. Quisque arcu lorem, ultricies quis pellentesque nec, ullamcorper eu odio.
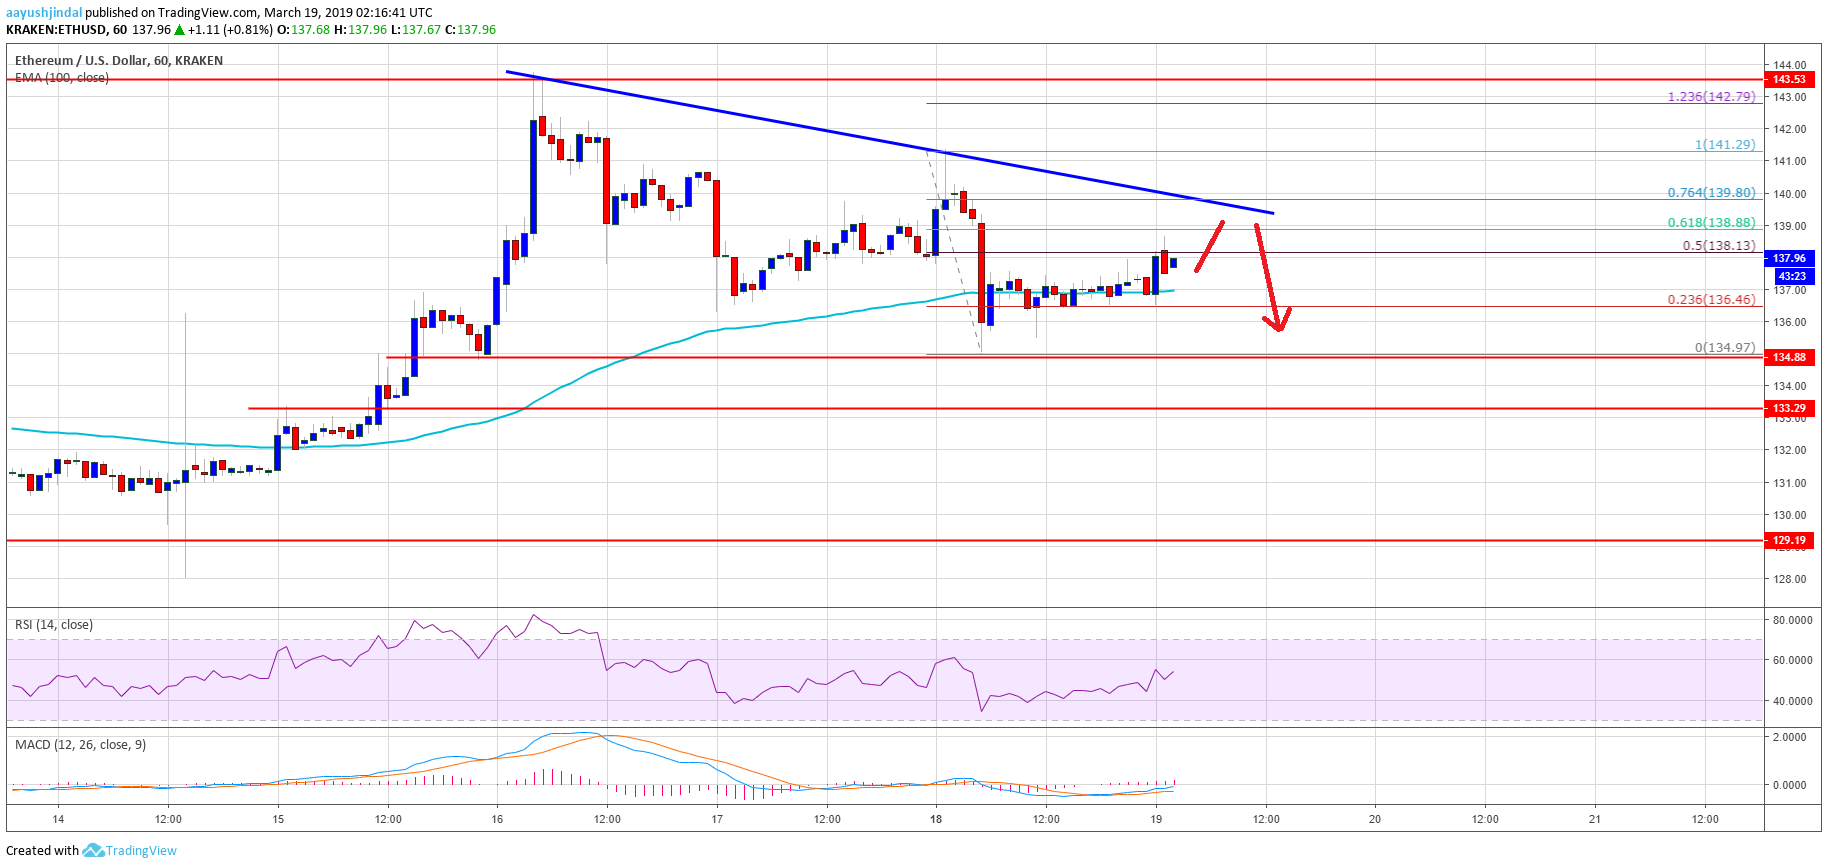
- ETH price failed to climb above the $140-141 resistance area and declined against the US Dollar.
- The price even broke the $137 support level and traded to a new weekly low near $135.
- This is a major bearish trend line formed with resistance at $140 on the hourly chart of ETH/USD (data feed via Kraken).
- The pair may extend the current downside correction if it fails to surpass the $140 resistance area.
Ethereum price is slowly moving into a bearish zone against the US Dollar and bitcoin. ETH is now at a risk of a bearish reaction if it fails to climb above the $140 hurdle.
Ethereum Price Analysis
Yesterday, we saw the start of a downside correction in ETH price from the $144 swing high against the US Dollar. The ETH/USD pair declined below the $140 support level and traded close to the $137 level. Later, there was an upside correction, but the price failed to clear the $140-141 resistance area. The price also failed to climb above the 61.8% Fib retracement level of the last slide from the $144 swing high to $137 swing low. As a result, there was a fresh drop and the price even broke the $137 support level.
A new weekly low was formed near the $135 level and the price is currently correcting higher. It moved above the $137 level and the 100 hourly simple moving average. There was a break above the 50% Fib retracement level of the recent decline from the $141 high to $135 swing low. However, there is a strong resistance formed near the $140 and $141 levels. There is also a major bearish trend line formed with resistance at $140 on the hourly chart of ETH/USD.
An immediate resistance is just below $140 and near the 61.8% Fib retracement level of the recent decline from the $141 high to $135 swing low. To resume the last bullish wave, the price must break the $140 resistance and the trend line. If buyers fail to push the price higher, there are chances of a fresh drop below the $135 swing low.
Looking at the chart, ETH price is currently correcting the last week’s gains from the $128 swing low. It is approaching a couple of important supports such as $135 and $136. Having said that, if it fails to climb above the $140-141 resistance area, there is a risk of a downside correction below $135.
ETH Technical Indicators
Hourly MACD – The MACD for ETH/USD is slowly gaining pace in the bullish zone.
Hourly RSI – The RSI for ETH/USD spiked above the 50 level and it is currently moving higher towards 60.
Major Support Level – $135
Major Resistance Level – $140


