
Reason to trust
How Our News is Made
Strict editorial policy that focuses on accuracy, relevance, and impartiality
Ad discliamer
Morbi pretium leo et nisl aliquam mollis. Quisque arcu lorem, ultricies quis pellentesque nec, ullamcorper eu odio.
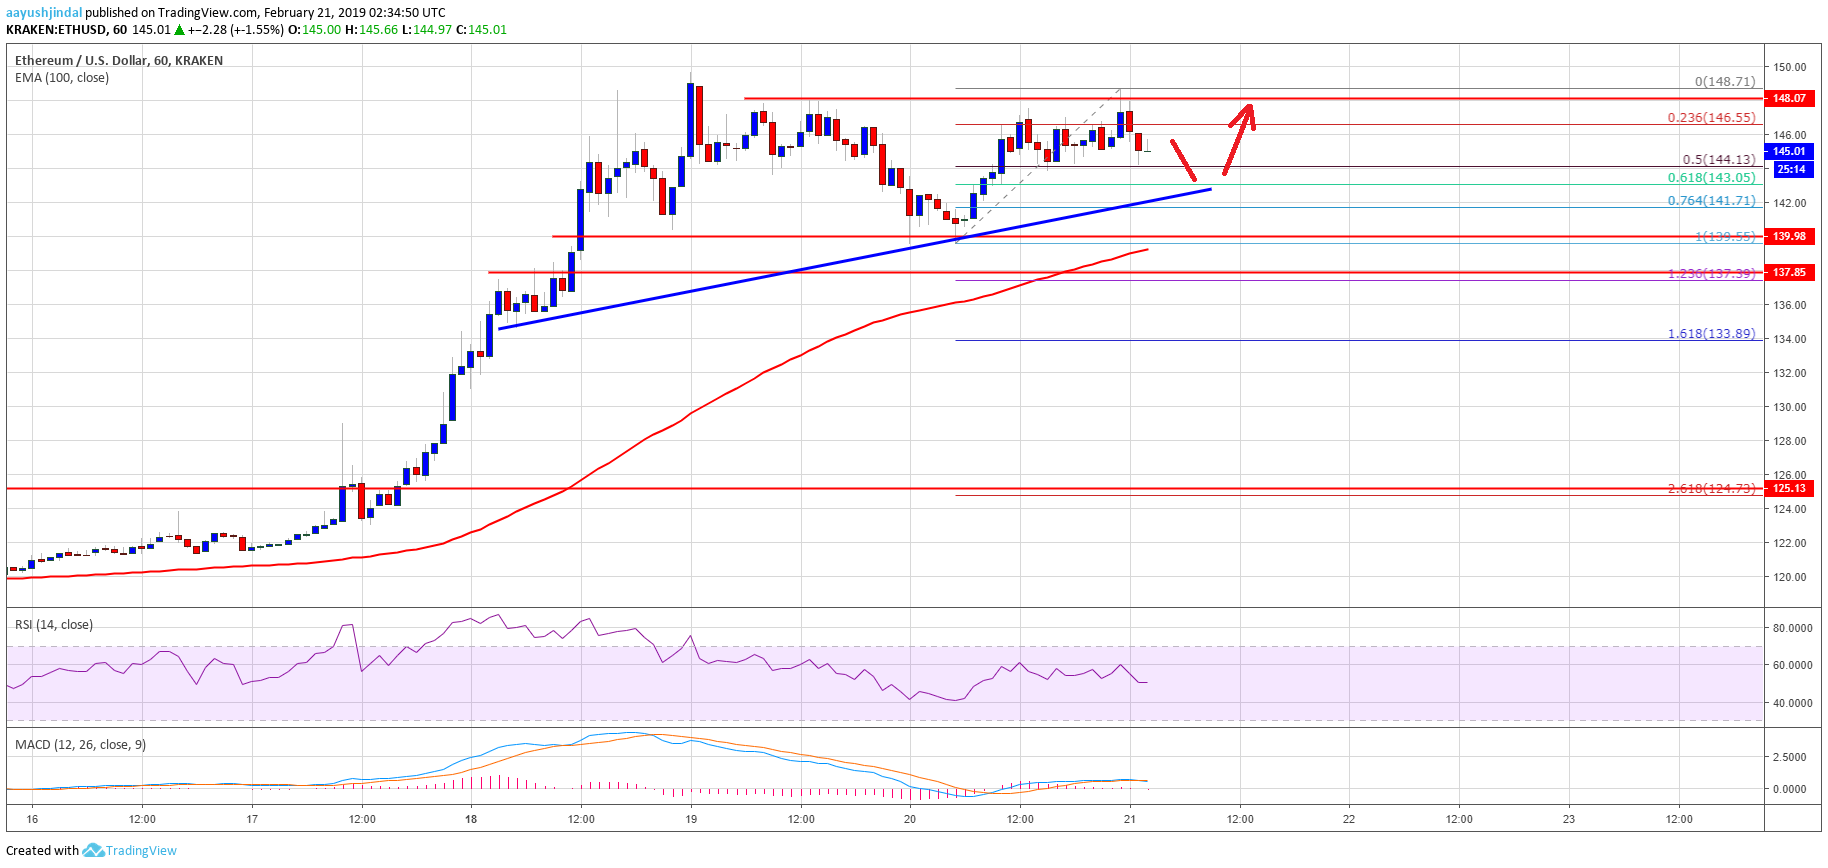
- ETH price remained well supported above the $138 and $140 levels against the US Dollar.
- The price recovered, but it struggled to break the $148 and $149 resistance levels.
- There is a new connecting bullish trend line forming with support at $143 on the hourly chart of ETH/USD (data feed via Kraken).
- The pair remains well bid and it is likely to break the $148 and $150 resistance levels in the near term.
Ethereum price is trading nicely in a positive zone against the US Dollar and bitcoin. ETH/USD will most likely break the $150 resistance and it could even surpass the $155 level.
Ethereum Price Analysis
Yesterday, we saw a downside correction in ETH price from the $149 and $150 resistances against the US Dollar. The ETH/USD pair declined below the $144 support level, but the $138 and $140 levels acted as a solid buy zone. As a result, the pair bounced back and traded above the $144 and $146 levels. However, sellers remained in control near the $148 and $149 resistance levels. There was no successful break above the $148 and $150 barriers. The last swing high was formed just below $149 and the price is currently correcting lower.
It already tested the 50% Fib retracement level of the last wave from the $140 swing low to $149 swing high. On the downside, there are many supports near the $143 and $144 levels. There is also a new connecting bullish trend line forming with support at $143 on the hourly chart of ETH/USD. Besides, the 61.8% Fib retracement level of the last wave from the $140 swing low to $149 swing high is also near the $143 level. Therefore, the $143 support is likely to act as a strong support.
Below $143, the next major support is near the $140 area, followed by $138. The 100 hourly simple moving average is also close to the $138 level to act as a support. As long as the price is trading above the $138 swing low, it remains supported for more gains. However, buyers need to take out the $148 and $149 resistance levels for further gains.
Looking at the chart, ETH price is clearly eyeing an upside break above the $148 and $150 resistances. Once buyers succeed in gaining strength above $150, the price could even break the $155 level in the near term. The next target could be $162.
ETH Technical Indicators
Hourly MACD – The MACD for ETH/USD is currently flat in the bullish zone, with a few positive signs.
Hourly RSI – The RSI for ETH/USD declined recently and tested the 50 level, with a flat structure.
Major Support Levels – $143 and $138.
Major Resistance Levels – $148, $149 and $150.


