
Reason to trust
How Our News is Made
Strict editorial policy that focuses on accuracy, relevance, and impartiality
Ad discliamer
Morbi pretium leo et nisl aliquam mollis. Quisque arcu lorem, ultricies quis pellentesque nec, ullamcorper eu odio.
- ETH price remained nicely supported on the downside above $120 and $118 against the US Dollar.
- Yesterday’s highlighted key bullish trend line is intact with support at $120 on the hourly chart of ETH/USD (data feed via Kraken).
- The pair is following a bullish structure and it could continue to move higher above $125 in the near term.
Ethereum price is slowly gaining bullish momentum against the US Dollar and bitcoin. ETH/USD is likely to break the recent high and trade above the $128 and $130 resistance levels.
Ethereum Price Analysis
In the past few sessions, there were mostly range moves below the $125 resistance in ETH price against the US Dollar. The ETH/USD pair dipped towards the $118 and $120 supports on a couple of occasions. However, buyers were able to defend losses, resulting in a bullish reaction. Recently, there was a nice upward move and the price spiked above the $125 resistance, but buyers failed to hold gains. A high was formed at $125.41 and later the price corrected lower. It dipped below the $124 and $122 levels. Besides, there was a break below the 50% Fib retracement level of the recent wave from the $117 low to $125 swing low.
The decline found support near the key $120 level. More importantly, yesterday’s highlighted key bullish trend line is intact with support at $120 on the hourly chart of ETH/USD. The pair also tested the 61.8% Fib retracement level of the recent wave from the $117 low to $125 swing low. At the outset, the price is trading nicely above the $120 support and the 100 hourly simple moving average. It seems like the price may continue to trade in a range above $120 before the next move. If there is a downside break below $120, $119, and the 100 hourly SMA, there could be more declines. The next stop for buyers could be the $115 area. It coincides with the 1.236 Fib extension level of the recent wave from the $117 low to $125 swing low.
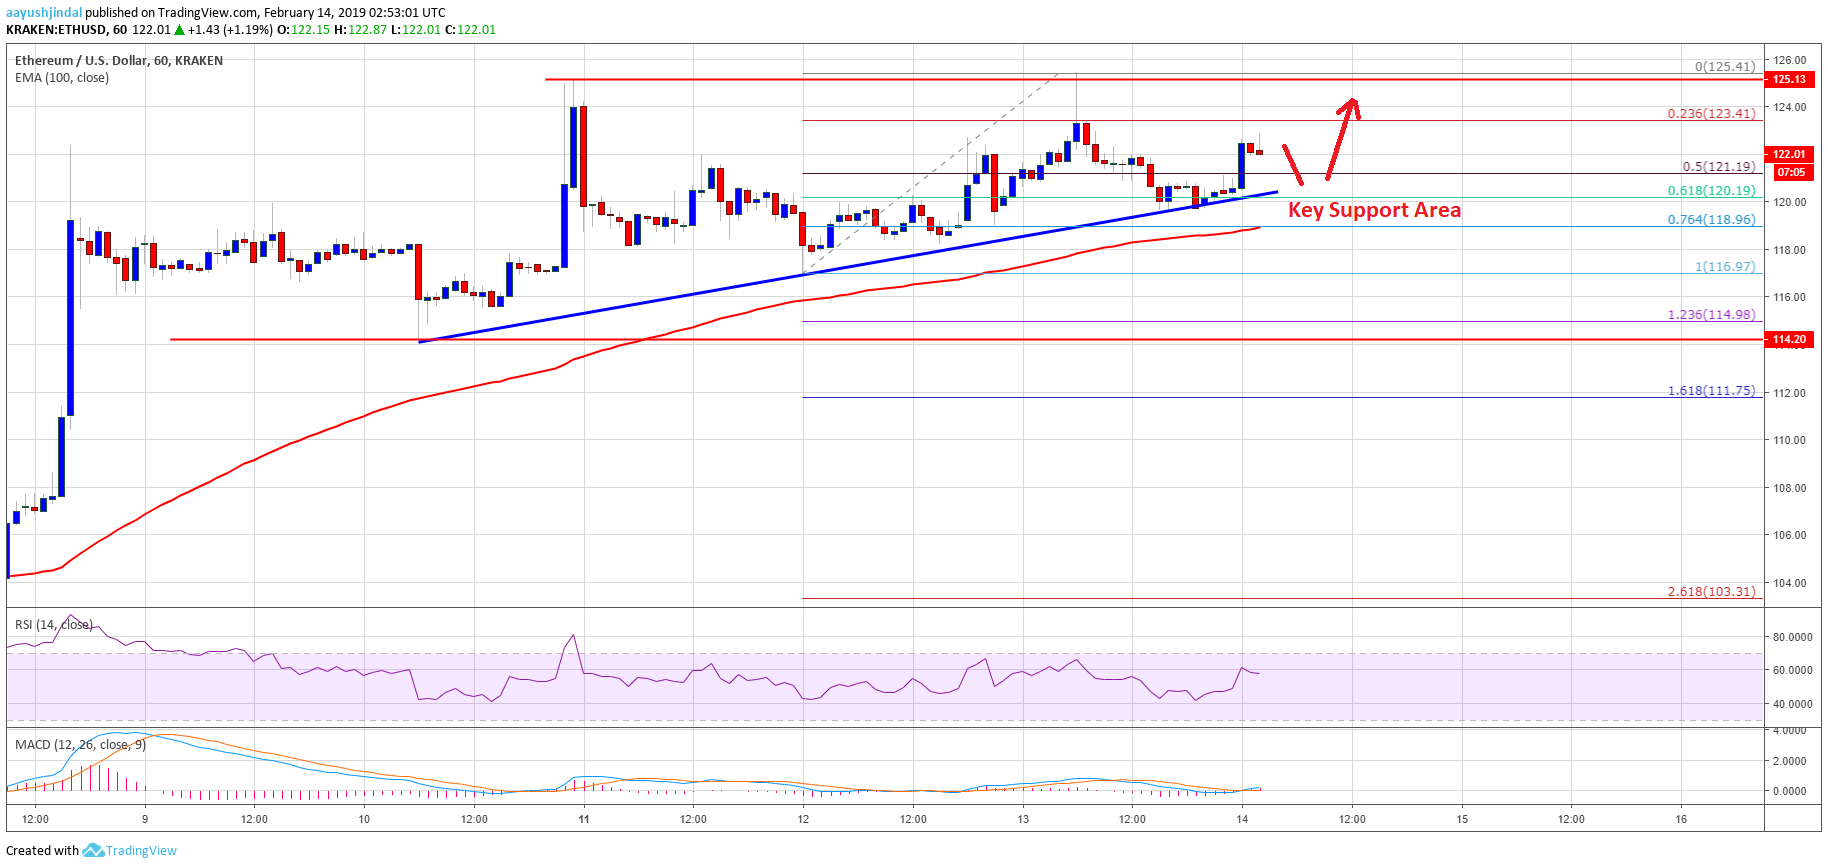
Looking at the chart, ETH price is clearly trading nicely above the $120 support. Having said that, buyers need the $125 resistance to gain strength. A clear break and follow through above $125 and $126 could set the pace for more upsides. The next key targets could be $128 and $130 in the near term.
ETH Technical Indicators
Hourly MACD – The MACD for ETH/USD is about to move back in the bullish zone, with positive signs.
Hourly RSI – The RSI for ETH/USD is currently placed well above the 50 level, with no bearish sign.
Major Support Level – $120
Major Resistance Level – $125


