
Reason to trust
How Our News is Made
Strict editorial policy that focuses on accuracy, relevance, and impartiality
Ad discliamer
Morbi pretium leo et nisl aliquam mollis. Quisque arcu lorem, ultricies quis pellentesque nec, ullamcorper eu odio.
- ETH price declined recently below $120 and tested the key $112 support area against the US Dollar.
- Yesterday’s highlighted important bearish trend line is intact with resistance at $118 on the hourly chart of ETH/USD (data feed via Kraken).
- The pair is currently consolidating below the $118 and $120 resistance, with a few positive moves.
Ethereum price is placed in a bearish zone against the US Dollar and bitcoin. ETH/USD must break the $118 and $120 resistances to start a short term upside correction.
Ethereum Price Analysis
Yesterday, we saw a nasty decline in ETH price from the $125 swing high against the US Dollar. The ETH/USD pair broke the $122, $120, $118 and $115 support levels to move into a bearish zone. It tested the $112 support area where buyers emerged. Later, the price started consolidating losses and corrected a few points above the $114 level. It traded above the 23.6% Fib retracement level of the last slide from the $123 swing high to $112 swing low.
However, there are many hurdles on the upside near the $118 level. The price made a couple of attempts to surpass the $117-118 zone, but buyers failed to gain momentum. Besides, the 50% Fib retracement level of the last slide from the $123 swing high to $112 swing low is also near $118. More importantly, yesterday’s highlighted important bearish trend line is intact with resistance at $118 on the hourly chart of ETH/USD. Finally, the 100 hourly simple moving average is positioned near the $120 level. Therefore, both $118 and $120 levels are crucial barriers for buyers in the short term.
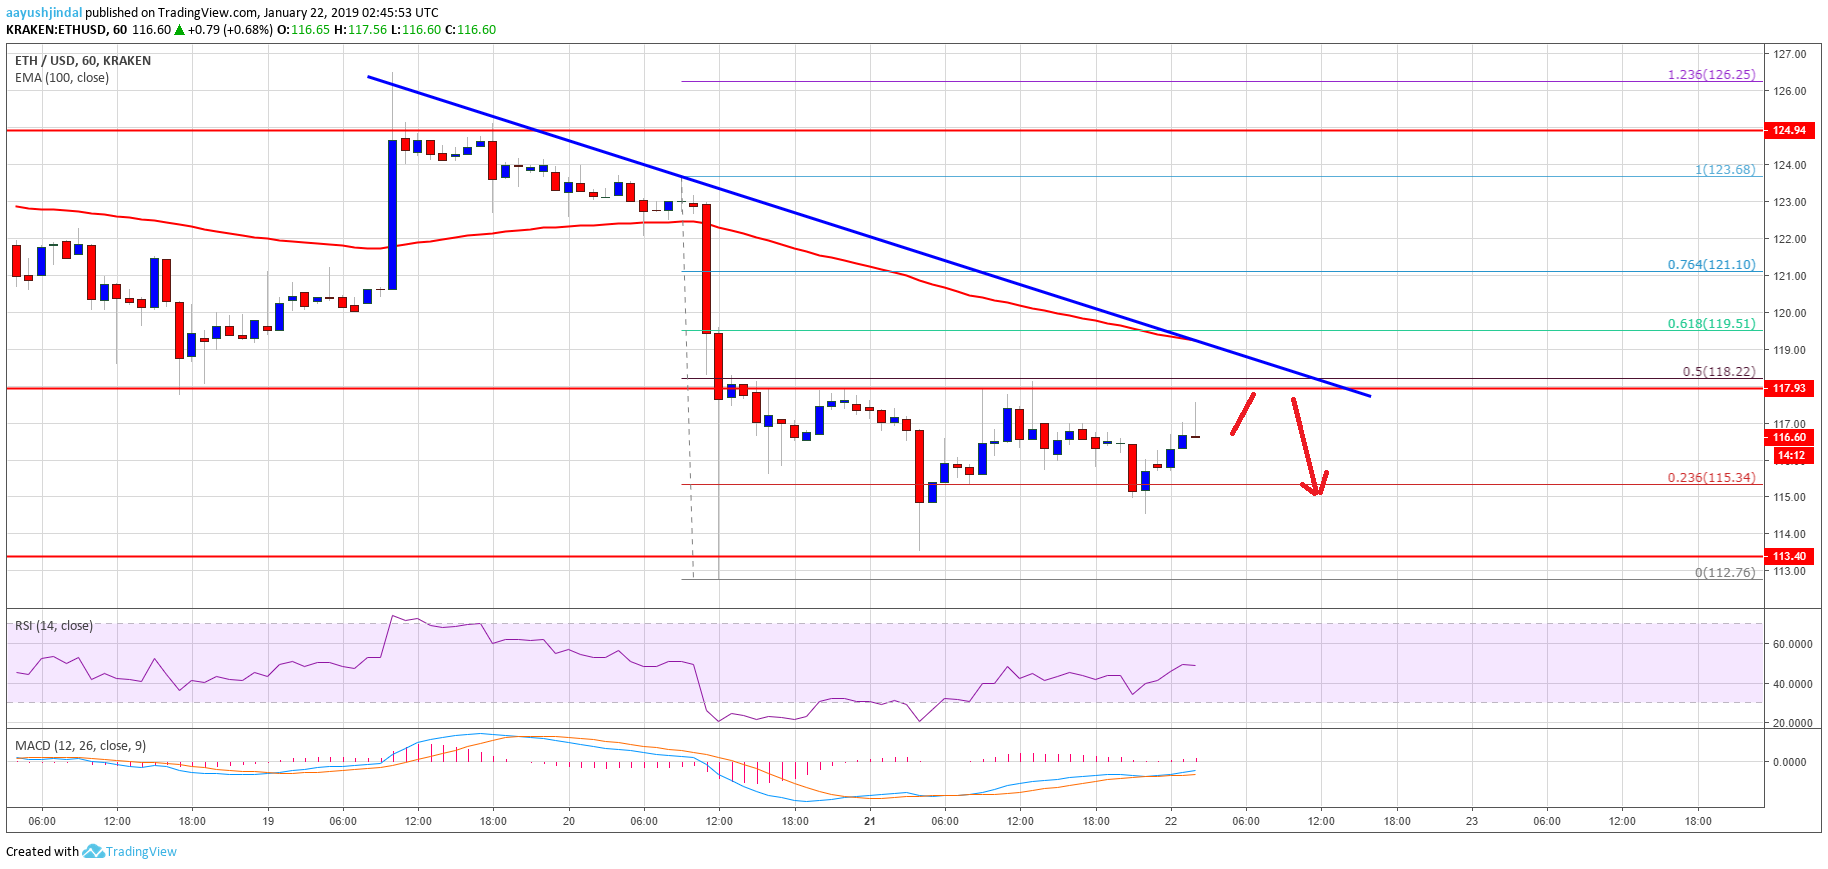
Looking at the chart, ETH price may continue to trade in a range above $112 before the next move. If buyers push the price above the $118 and $120 resistance, there could be a recovery towards $125. If not, the price could retest the $112 or $110 level.
ETH Technical Indicators
Hourly MACD – The MACD for ETH/USD is slightly placed in the bullish zone, with a flat structure.
Hourly RSI – The RSI for ETH/USD is currently moving higher towards the 50 and 55 levels.
Major Support Level – $113
Major Resistance Level – $120


