
Reason to trust
How Our News is Made
Strict editorial policy that focuses on accuracy, relevance, and impartiality
Ad discliamer
Morbi pretium leo et nisl aliquam mollis. Quisque arcu lorem, ultricies quis pellentesque nec, ullamcorper eu odio.
- ETH price corrected lower recently and tested the $39 support area against the US Dollar.
- The price found a strong buying interest near $139 and it recently bounced back.
- There was a break above a declining channel with resistance at $141 on the hourly chart of ETH/USD (data feed via Kraken).
- The pair is currently trading above the $142 level and it may continue to rise towards the $145 resistance.
Ethereum price stayed above important supports against the US Dollar and bitcoin. ETH is moving higher once again and it seems like bulls are eyeing a break above the $145 swing high.
Ethereum Price Analysis
Recently, ETH price started a downside correction after testing the $145-146 resistance area against the US Dollar. The ETH/USD pair corrected below the $143 and $142 levels. The price even broke the $140 support level and tested the key $139 support area. Buyers emerged near the $139 support and the 100 hourly simple moving average. After a downside spike, the price started a fresh upward move and traded above the $140 resistance level.
Later, there was a break above a declining channel with resistance at $141 on the hourly chart of ETH/USD. The pair spiked above the 50% Fib retracement level of the recent decline from the $145 swing high to $139 swing low. Ethereum price settled above the $142 level, but it faced hurdles near the $143 level. The 61.8% Fib retracement level of the recent decline from the $145 swing high to $139 swing low also acted as a resistance. At the moment, the price is currently consolidating gains above $142 and it may dip a few points.
On the downside, the $142 and $141 support levels might prevent declines. On the upside, a clear break above the $143 resistance could push the price towards the $145 resistance area. Above $145, the next target for buyers could be near the $150 level. On the downside, if there is an increase in selling pressure, the price may revisit the $139 support and the 100 hourly SMA.
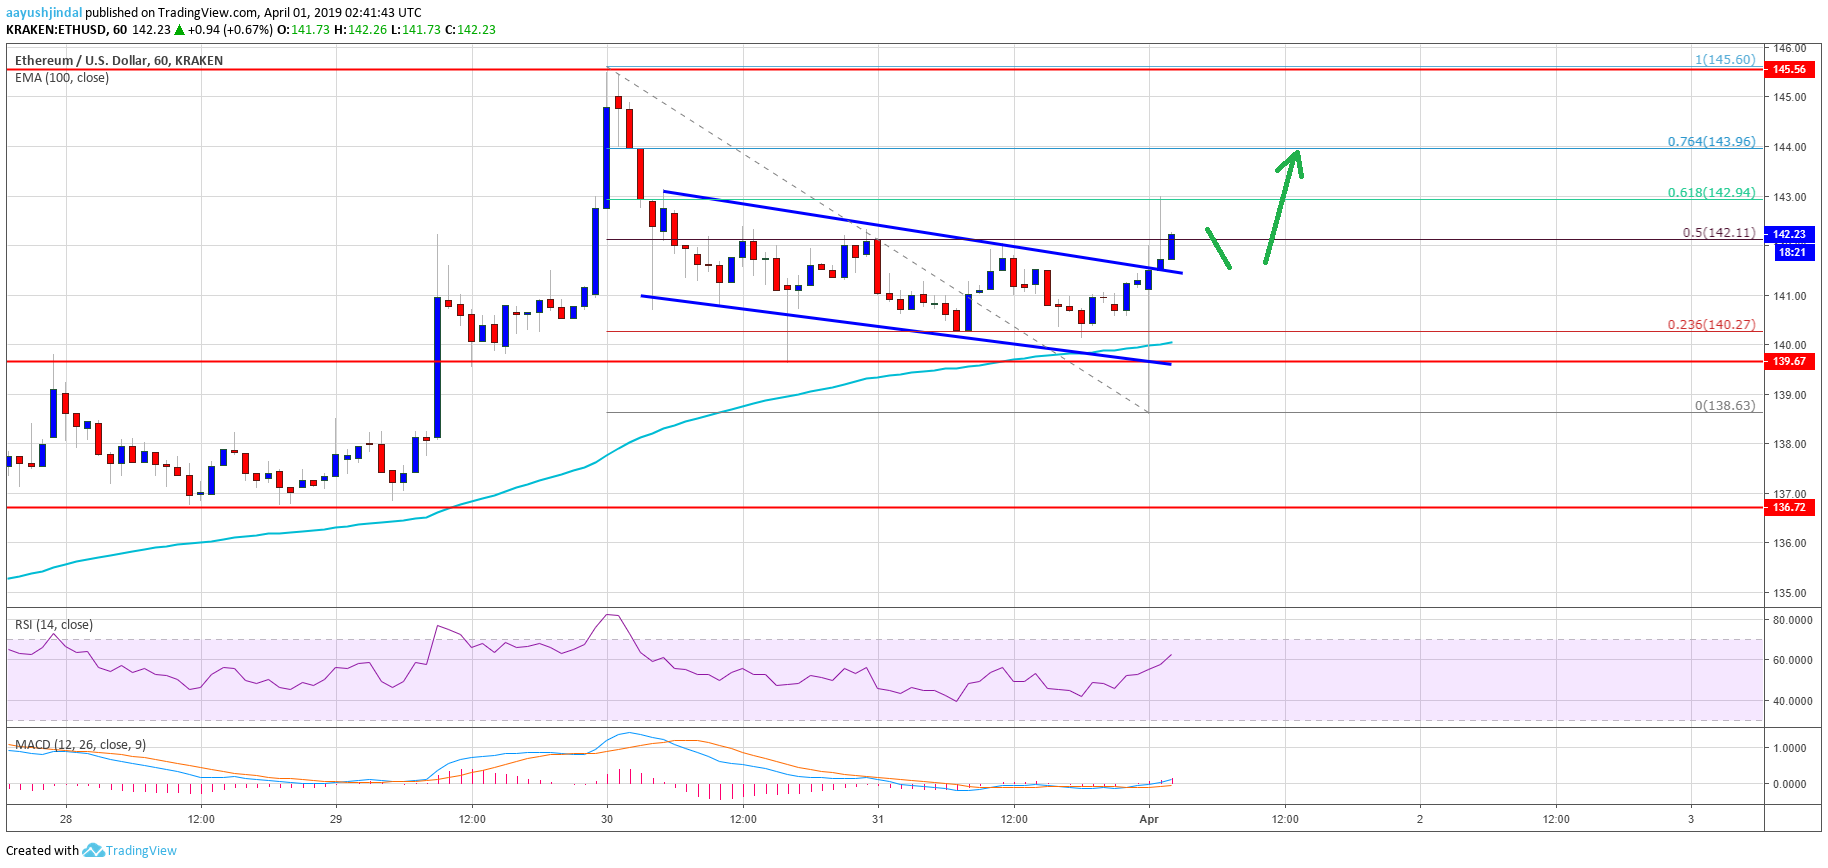
Looking at the chart, Ethereum price is clearly holding key supports above the $139 level and the 100 hourly SMA. If bulls fail to defend the $139 support, the price may move into a bearish zone. The next key support is near the $137 level (the previous pivot level). Overall, as long as the price is above $139, it could continue to rise towards $145 and $150.
ETH Technical Indicators
Hourly MACD – The MACD for ETH/USD is gaining momentum in the bullish zone.
Hourly RSI – The RSI for ETH/USD is currently moving higher towards the 70 level.
Major Support Level – $139
Major Resistance Level – $143


