
Reason to trust
How Our News is Made
Strict editorial policy that focuses on accuracy, relevance, and impartiality
Ad discliamer
Morbi pretium leo et nisl aliquam mollis. Quisque arcu lorem, ultricies quis pellentesque nec, ullamcorper eu odio.
Ethereum is down close to 15% and it broke the key $215 support against the US Dollar. ETH price remains at a risk of more losses below the $200 and $195 support levels.
- Ethereum is trading in a nasty downtrend below the $220 support area against the US Dollar.
- The price even spiked below the $200 handle and it might continue to move down.
- There is a key declining channel forming with resistance near $205 on the hourly chart of ETH/USD (data feed via Kraken).
- Bitcoin price is down close to 8% and it tested the $8,000 support area.
Ethereum Price Turns Red
In yesterday’s weekly forecast, we discussed a crucial breakdown pattern in Ethereum near $225 and $220 against the US Dollar. ETH price failed to recover and climb above the $235 resistance, resulting in a sharp decline.
The bears took control and the price nosedived close to 15%. There was a break below the key $215 support area and the 100 hourly simple moving average. Moreover, the bears were able to push the price below the $200 handle.
A new monthly low is formed near $196 and the price is currently consolidating losses. Ethereum is testing the 23.6% Fib retracement level of the recent decline from the $232 high to $196 low.
There is also a key declining channel forming with resistance near $205 on the hourly chart of ETH/USD. If the pair fails to recover above the channel resistance and $208, there are chances of more losses.
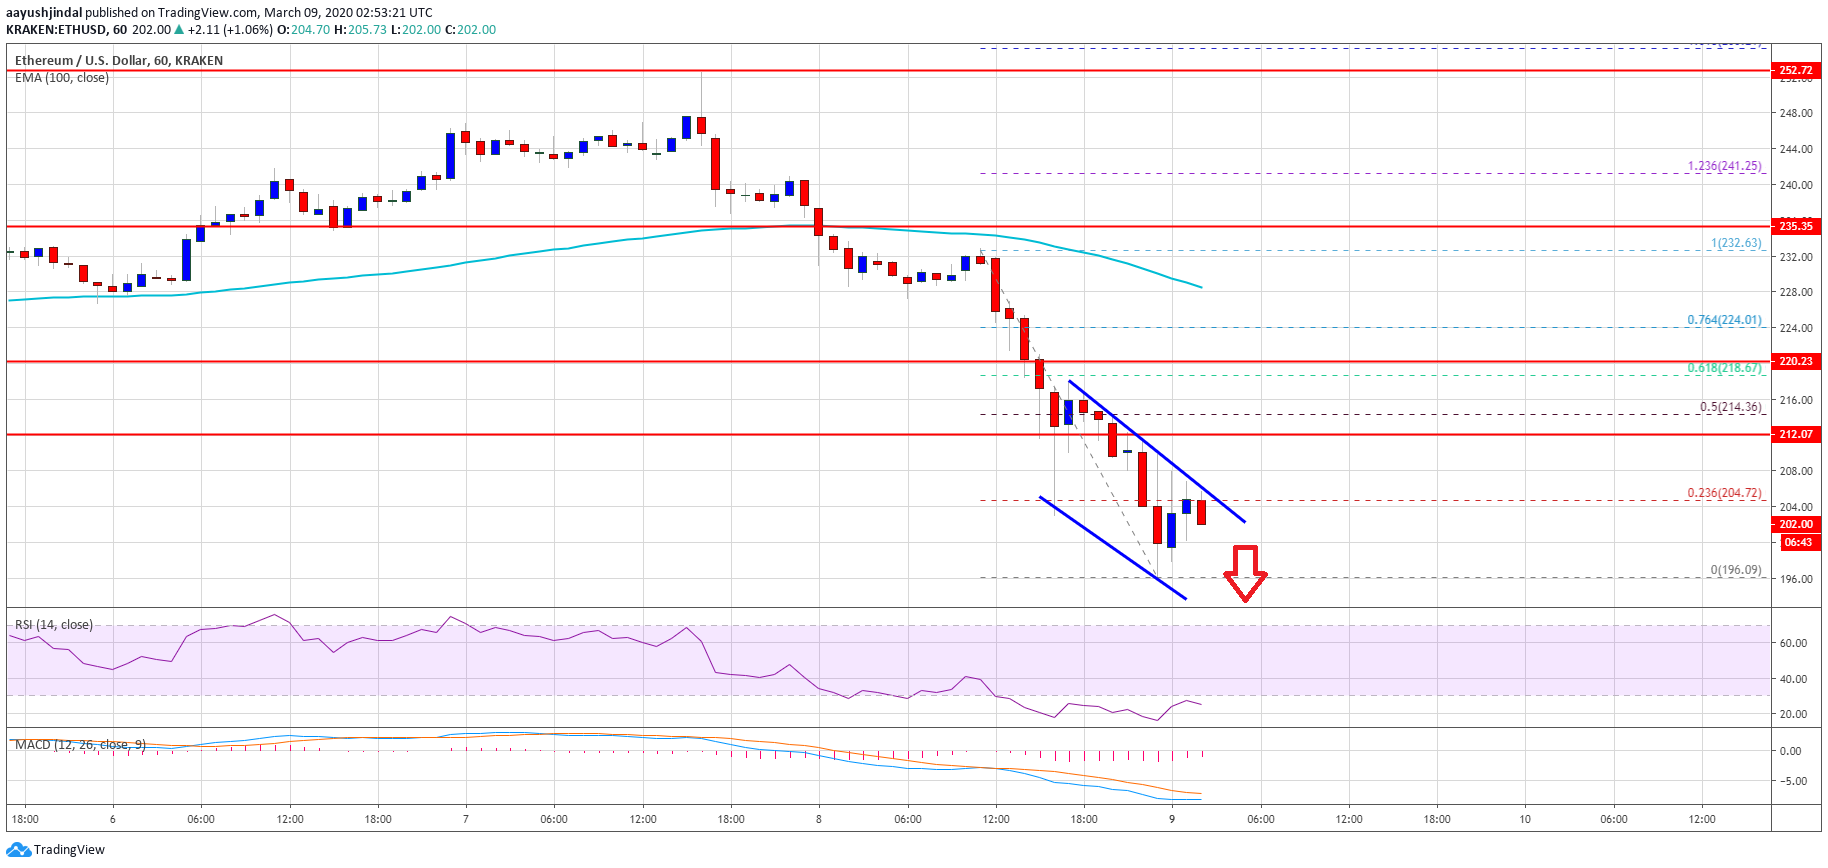
An initial support is near the $200 and $195 levels. A successful downside break below the $196 low could open the doors for a test of the main $185 support, where the bulls are likely to take a stand.
Chances of a Recovery
If Ethereum manages to recover above the channel resistance and $208, it may perhaps start a decent short term recovery. The next resistance is seen near the $212 and $215 levels.
The 50% Fib retracement level of the recent decline from the $232 high to $196 low is also near the $215 level to act as a strong resistance. Therefore, the bulls are likely to face a lot of hurdles near the $212 and $215 levels if there is an upside correction in the near term.
Technical Indicators
Hourly MACD – The MACD for ETH/USD is slowly reducing its bearish slope, but there are still many negative signs.
Hourly RSI – The RSI for ETH/USD is currently well below the 40 level.
Major Support Level – $195
Major Resistance Level – $212


