
Reason to trust
How Our News is Made
Strict editorial policy that focuses on accuracy, relevance, and impartiality
Ad discliamer
Morbi pretium leo et nisl aliquam mollis. Quisque arcu lorem, ultricies quis pellentesque nec, ullamcorper eu odio.
Ethereum is trading in a range above the $240 support region against the US Dollar. ETH price is likely to end the current consolidation and rally above the $250 resistance.
- Ethereum is still trading in a range above the $240 support and the 100 hourly simple moving average.
- The price is likely to start a strong increase if it clears the $250 resistance zone.
- There is a key bearish trend line forming with resistance near $245 on the hourly chart of ETH/USD (data feed via Kraken).
- The pair must settle above the $250 resistance zone to start a steady rise.
Ethereum Price Holding Key Supports
Ethereum price traded in a crucial range above the main $240 support zone. ETH revisited the range support at $240 recently and it is currently moving higher.
It seems to be trading nicely above the $242 level and the 100 hourly simple moving average. There was a break above the 50% Fib retracement level of the recent decline from the $248 swing high to $240 low.
However, the $245 level is currently acting as a resistance. There is also a key bearish trend line forming with resistance near $245 on the hourly chart of ETH/USD. The trend line is close to the 61.8% Fib retracement level of the recent decline from the $248 swing high to $240 low.
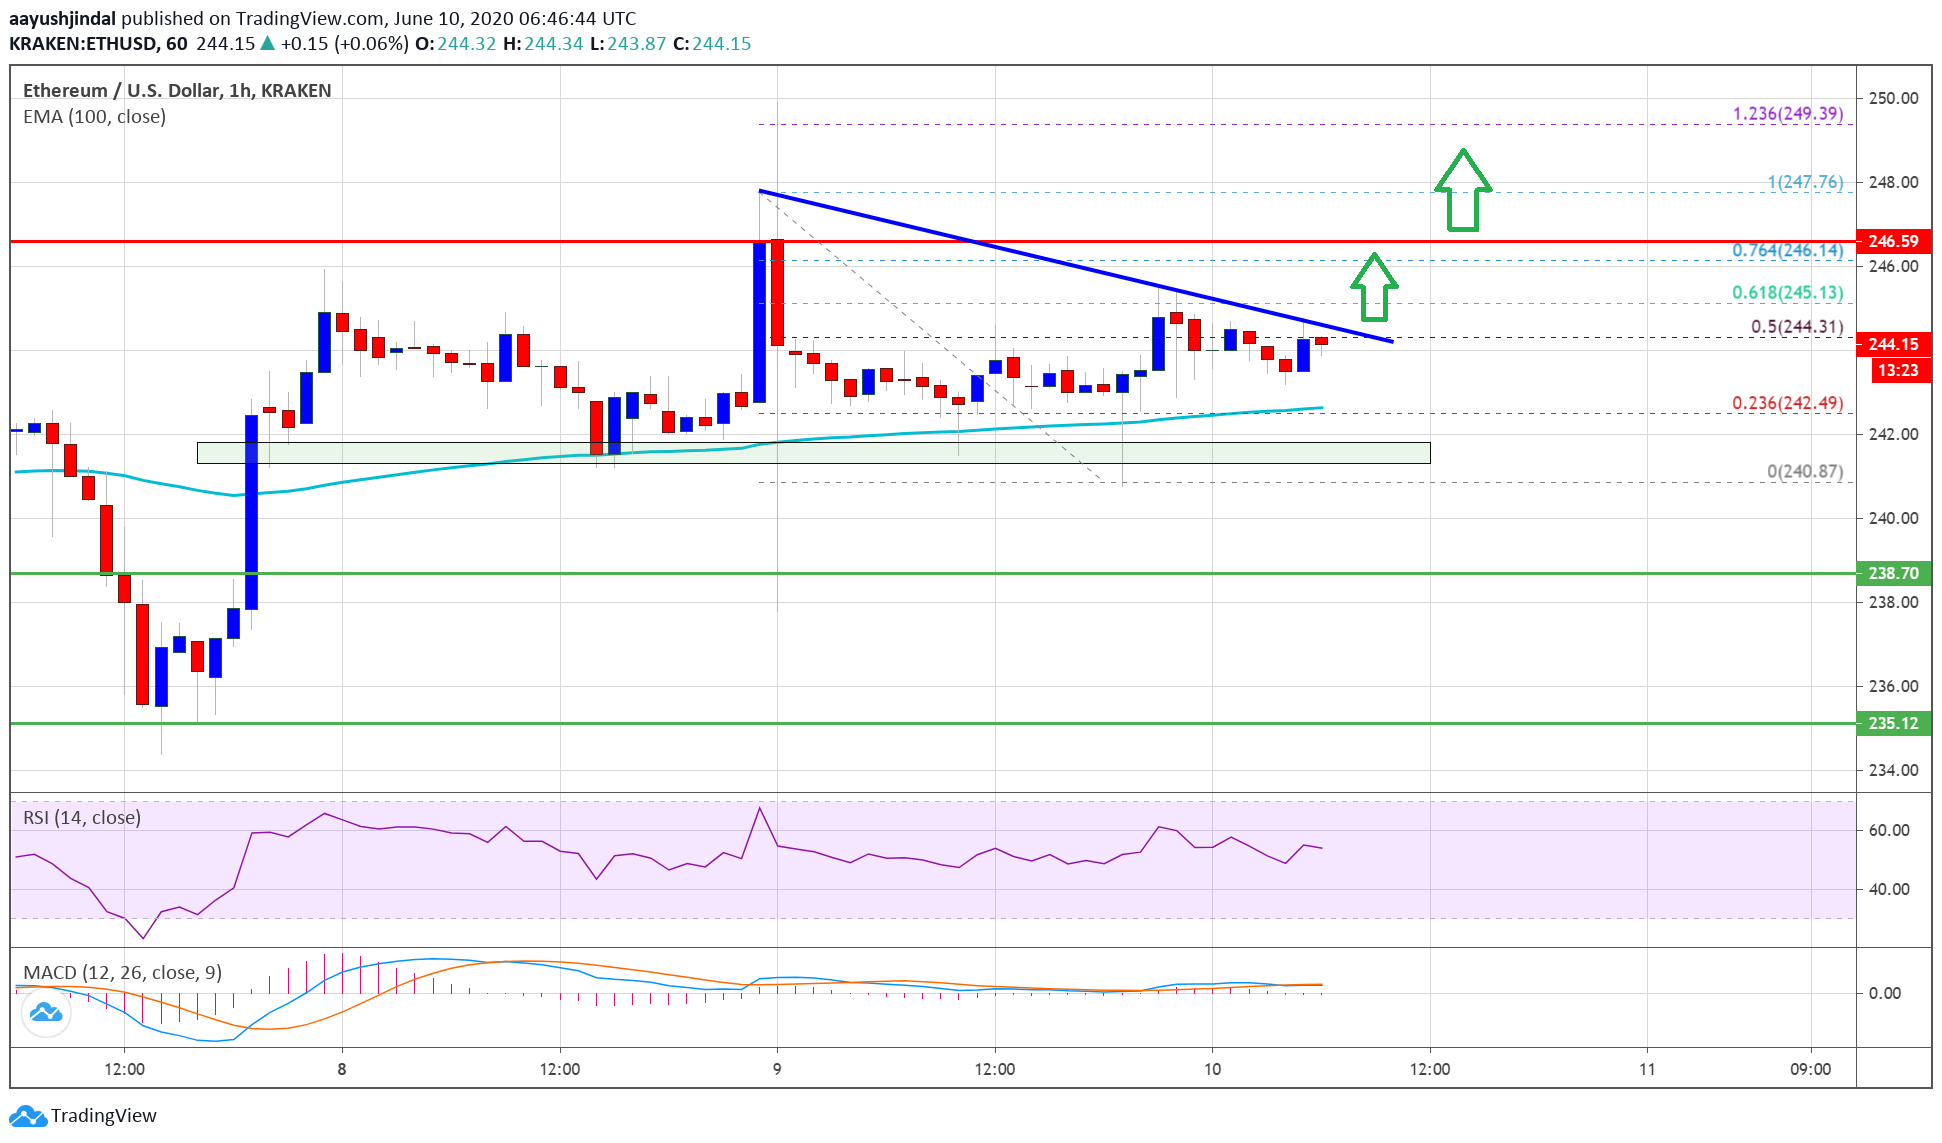
If there is an upside break above the trend line, ether price could make another attempt to clear the $248 and $250 resistance levels. A successful close above the $250 resistance is needed for a sustained upward move.
In the mentioned bullish case, there are chances of a sharp 8% to 15% rise towards the $265 and $280 levels in the near term.
Bearish Break in ETH
On the downside, there is a key breakdown support forming near the $240 level and the 100 hourly simple moving average. If Ethereum settles below the $240 level, there is a risk of a sharp decline.
An initial support after the breakdown could be near the $230 level, below which the bears are likely to aim a test of the $220 level. Any further losses could lead the price towards the $205 level.
Technical Indicators
Hourly MACD – The MACD for ETH/USD is slowly moving in the bullish zone.
Hourly RSI – The RSI for ETH/USD is currently just above the 50 level.
Major Support Level – $240
Major Resistance Level – $250
Take advantage of the trading opportunities with Plus500
Risk disclaimer: 76.4% of retail CFD accounts lose money.


