
Reason to trust
How Our News is Made
Strict editorial policy that focuses on accuracy, relevance, and impartiality
Ad discliamer
Morbi pretium leo et nisl aliquam mollis. Quisque arcu lorem, ultricies quis pellentesque nec, ullamcorper eu odio.
Ethereum is up more than 8% and it broke the key $215 resistance zone against the US Dollar. ETH price is trading nicely above $220 and it could continue to rise above $230.
- Ethereum is showing a lot of positive signs and it rallied above $215 and $220.
- The price is likely to continue higher towards the $230 and $240 levels.
- There is a connecting bullish trend line forming with support near $212 on the hourly chart of ETH/USD (data feed via Kraken).
- The pair remains well supported on dips near $215 and $212 in the near term.
Ethereum Price Surging
Ethereum price remained in a strong uptrend above the $205 level and it gained pace above the $210 barrier. ETH price managed to surpass the main $215 resistance zone to move into a bullish zone.
There was also a close above the $215 level and the 100 hourly simple moving average. Ether traded as high as $225 and it is currently consolidating gains. It tested the 23.6% Fib retracement level of the recent rally from the $204 swing low to $224 high.
The first major support on the downside is near the $215 zone. It is close to the 50% Fib retracement level of the recent rally from the $204 swing low to $224 high.
More importantly, there is a connecting bullish trend line forming with support near $212 on the hourly chart of ETH/USD. On the upside, the price is likely to continue higher above the $224 and $225 levels.
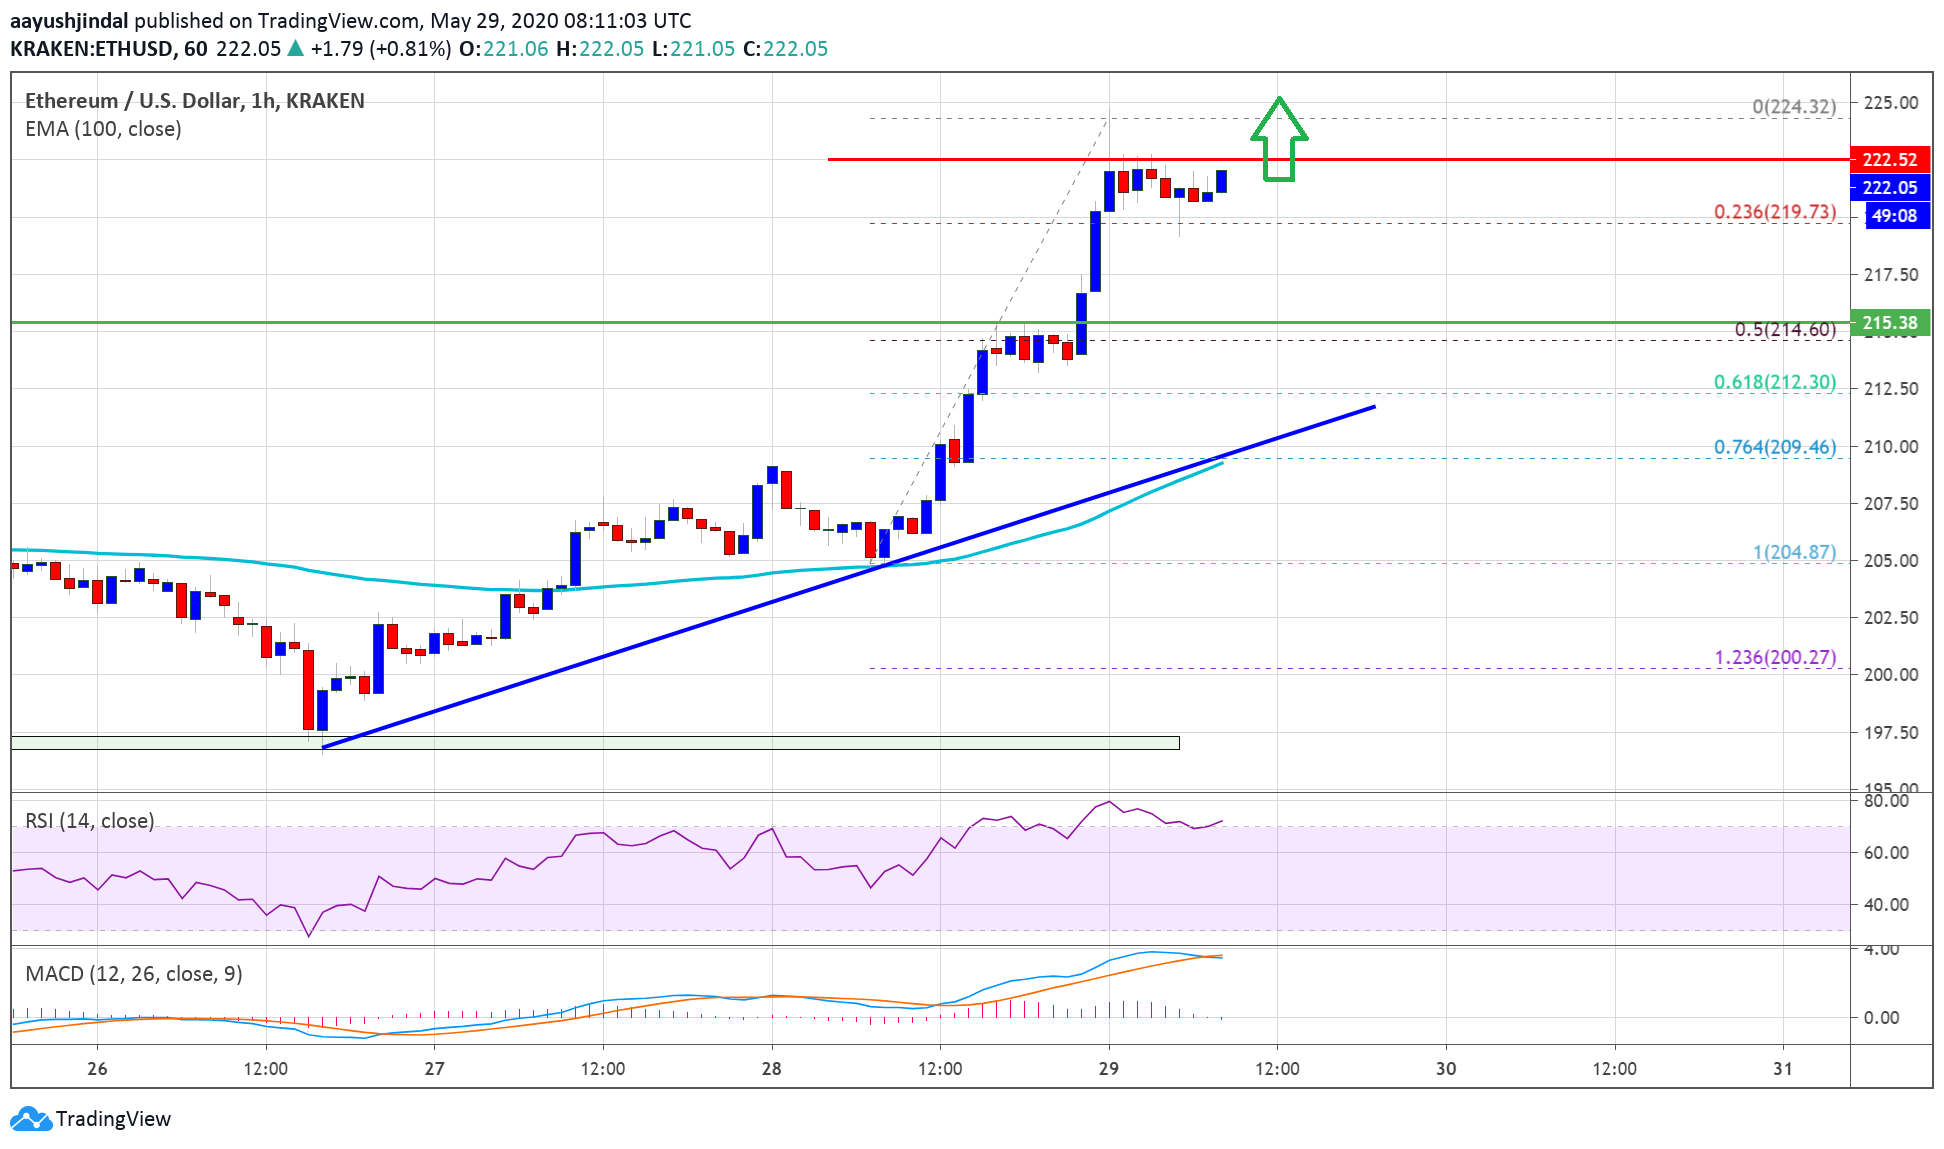
The first major resistance is near the $230 level. If there is a clear break above the $230 level, the price is likely to accelerate higher towards the $240 level. Any further gains could lead the price towards the $250 level.
Dips Supported in ETH
If Ethereum starts a downside correction, it is likely to remains supported near the $215 support zone (the recent breakout area). The trend line support at $212 is also a major support.
If there is a downside break below the $212 support zone, the price is likely to test the main $210 support and the 100 hourly simple moving average, which is also a key breakdown area.
Technical Indicators
Hourly MACD – The MACD for ETH/USD is gaining momentum in the bullish zone.
Hourly RSI – The RSI for ETH/USD is now well above the 60 level, with a positive angle.
Major Support Level – $215
Major Resistance Level – $225
Take advantage of the trading opportunities with Plus500
Risk disclaimer: 76.4% of retail CFD accounts lose money.


