
Reason to trust
How Our News is Made
Strict editorial policy that focuses on accuracy, relevance, and impartiality
Ad discliamer
Morbi pretium leo et nisl aliquam mollis. Quisque arcu lorem, ultricies quis pellentesque nec, ullamcorper eu odio.
- ETH price started a downside correction after testing the $188 level against the US Dollar.
- The price declined below the $174 and $165 support levels to move into a short term bearish zone.
- There is a crucial bullish trend line forming with support at $155 on the 4-hours chart of ETH/USD (data feed via Kraken).
- The pair could decline further towards the $155 support before it could bounce back.
Ethereum price started a major downside correction versus the US Dollar and bitcoin. ETH is currently under pressure and it seems like the price could test the $155 support before higher.
Ethereum Price Weekly Analysis
This past week, Ethereum price traded towards the $185 and $188 resistance levels against the US Dollar. The ETH/USD pair faced a strong selling interest near the $185 resistance zone, resulting in a bearish reaction. The price started a downside correction and broke the key $174 support area. There was a break below the $170 level and the 50% Fib retracement level of the last wave from the $154 swing low to $188 swing high.
It opened the doors for more losses and the price declined below the $165 support. It tested the $162 support area and the 100 simple moving average (4-hours). Besides, the 76.4% Fib retracement level of the last wave from the $154 swing low to $188 swing high. On the downside, there is a crucial bullish trend line formed with support at $155 on the 4-hours chart of ETH/USD. The pair is likely to find a strong buying interest near the $155 and $156 support levels. It seems like there could be a final downside push towards the $155 level before the price could bounce back sharply.
On the upside, an initial resistance is near the $166 level, above which the price may revisit the $170 level. However, the main resistance is at $175, above which the price is likely to resume its upward move above $180 in the coming days. On the other hand, if the price fails to hold the $155 support area, there could be more losses in the near term.
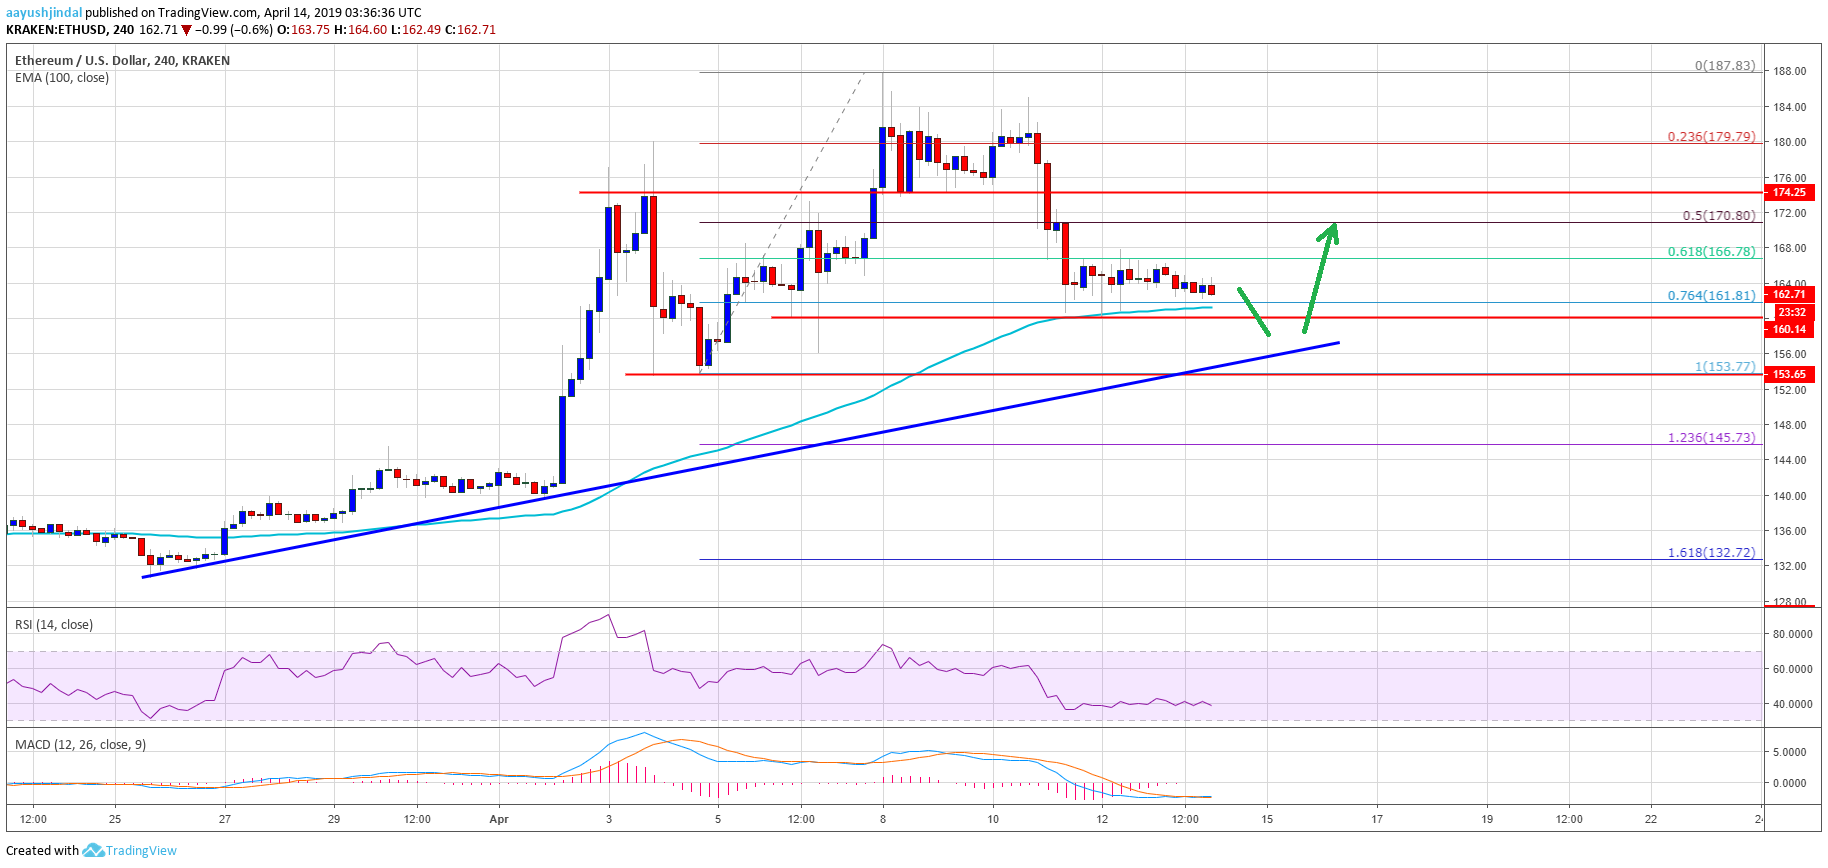
The above chart indicates that Ethereum is approaching a few important supports levels near the $155 and $156 levels. As long as the price is trading above the $155 support, there are chances of a fresh increase above the $170 level. Below $155, the next immediate support is at $152, below which the price may test $144.
Technical Indicators
4 hours MACD – The MACD for ETH/USD is about to move back in the bullish zone.
4 hours RSI – The RSI for ETH/USD is currently positioned well below the 45 level.
Major Support Level – $155
Major Resistance Level – $170


