
Reason to trust
How Our News is Made
Strict editorial policy that focuses on accuracy, relevance, and impartiality
Ad discliamer
Morbi pretium leo et nisl aliquam mollis. Quisque arcu lorem, ultricies quis pellentesque nec, ullamcorper eu odio.
- ETH price failed to stay above the $158 and the $160 support levels against the US Dollar.
- Tether drama sparked a strong declined below the $155 and $150 support levels.
- Yesterday’s highlighted key bearish trend line is intact with resistance near $162 on the hourly chart of ETH/USD (data feed via Kraken).
- The pair is back in a downtrend and sellers are likely to remain active near $155 or $160.
Ethereum price tumbled below many key supports versus the US Dollar and bitcoin. ETH price even broke the $150 support zone to move back in a downtrend.
Ethereum Price Analysis
Yesterday, we discussed the chances of one last dip towards $158 in Ethereum price against the US Dollar. The ETH/USD pair failed to stay above the $160 and $158 support levels. There was a strong decline below the $155 support and the price settled well below the 100 hourly simple moving average. The decline was such that the price even failed to stay above the $150 support level. It traded close to the $146 level and formed a new weekly swing low.
At the moment, the price is correcting higher above the $150 level. It broke the 23.6% Fib retracement level of the recent decline from the $165 high to $146 swing low. It seems like the price is back in a downtrend and any recovery towards the $155 level may face sellers. The stated $155 level now coincides with the 50% Fib retracement level of the recent decline from the $165 high to $146 swing low. Above $155, the next major resistance is near the $160 level.
Moreover, yesterday’s highlighted key bearish trend line is intact with resistance near $162 on the hourly chart of ETH/USD. Below the trend line, the 76.4% Fib retracement level of the recent decline from the $165 high to $146 swing low is near the $161 level. Therefore, any major upside correction could face a strong selling interest near the $160, $161 and $162 levels. On the downside, an initial support is near the $145 and $146 levels. Below $145, the price could test the $125 support.
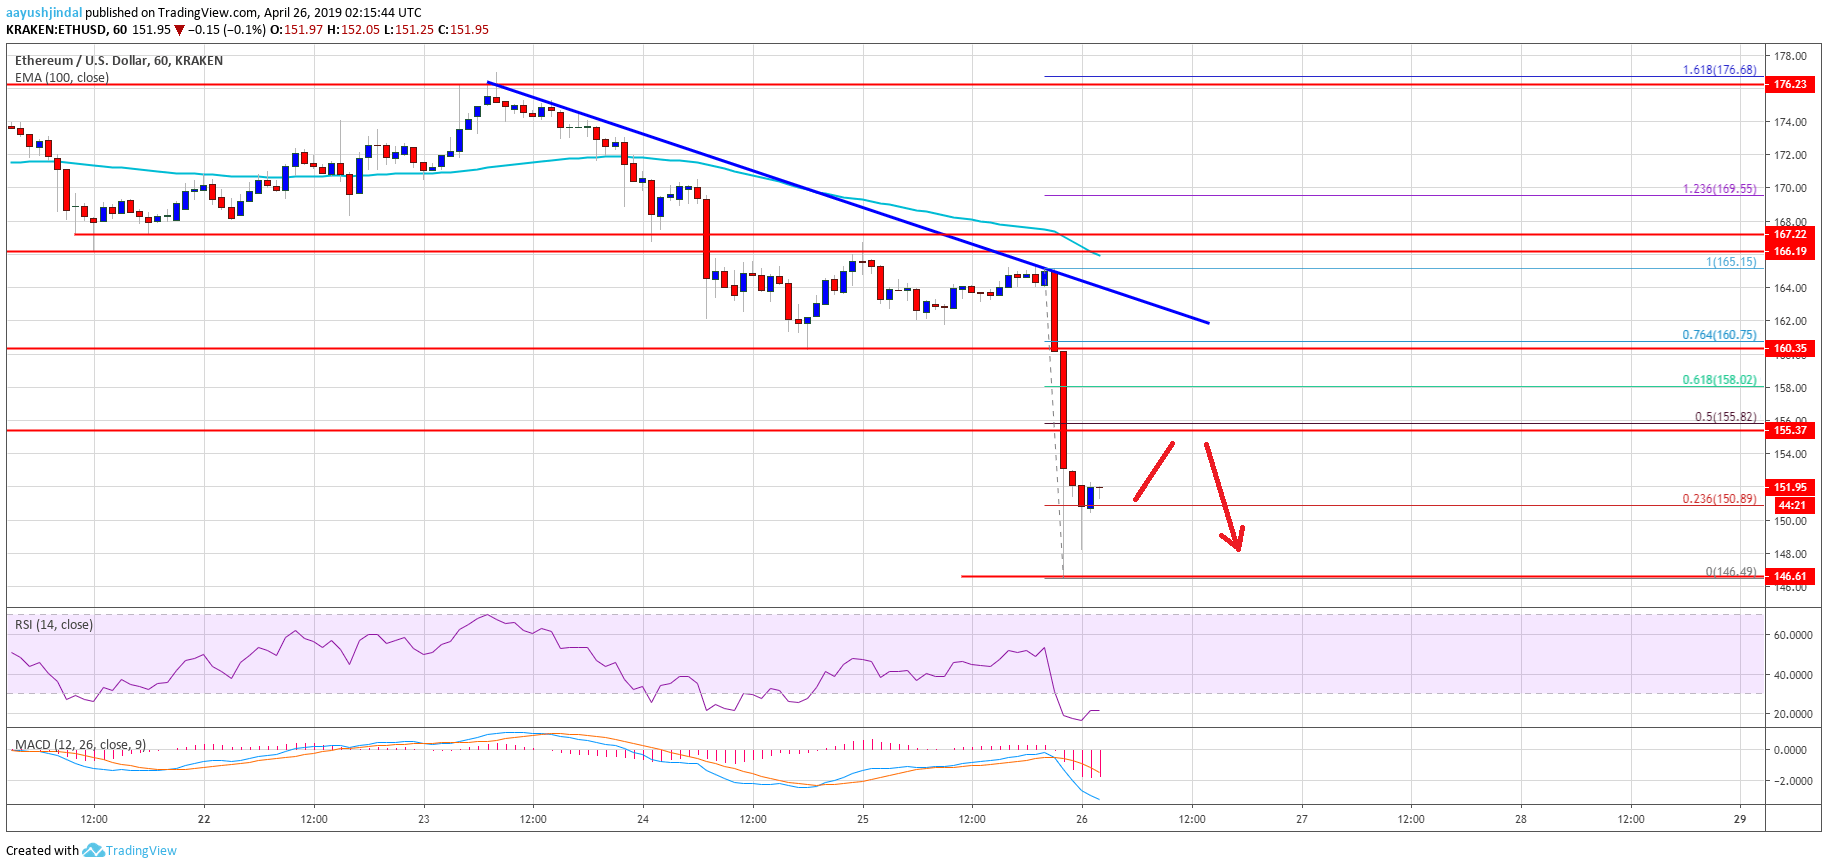
Looking at the chart, Ethereum price declined heavily below key supports near the $160 level. It is clearly trading in a bearish zone below the $160 pivot level. In the short term, there could be an upside correction, but sellers are likely to protect the $158 and $160 levels.
ETH Technical Indicators
Hourly MACD – The MACD for ETH/USD is likely to reduce its bearish slope in the short term.
Hourly RSI – The RSI for ETH/USD declined heavily and it is currently in the oversold zone near 20.
Major Support Level – $145
Major Resistance Level – $160


