
Reason to trust
How Our News is Made
Strict editorial policy that focuses on accuracy, relevance, and impartiality
Ad discliamer
Morbi pretium leo et nisl aliquam mollis. Quisque arcu lorem, ultricies quis pellentesque nec, ullamcorper eu odio.
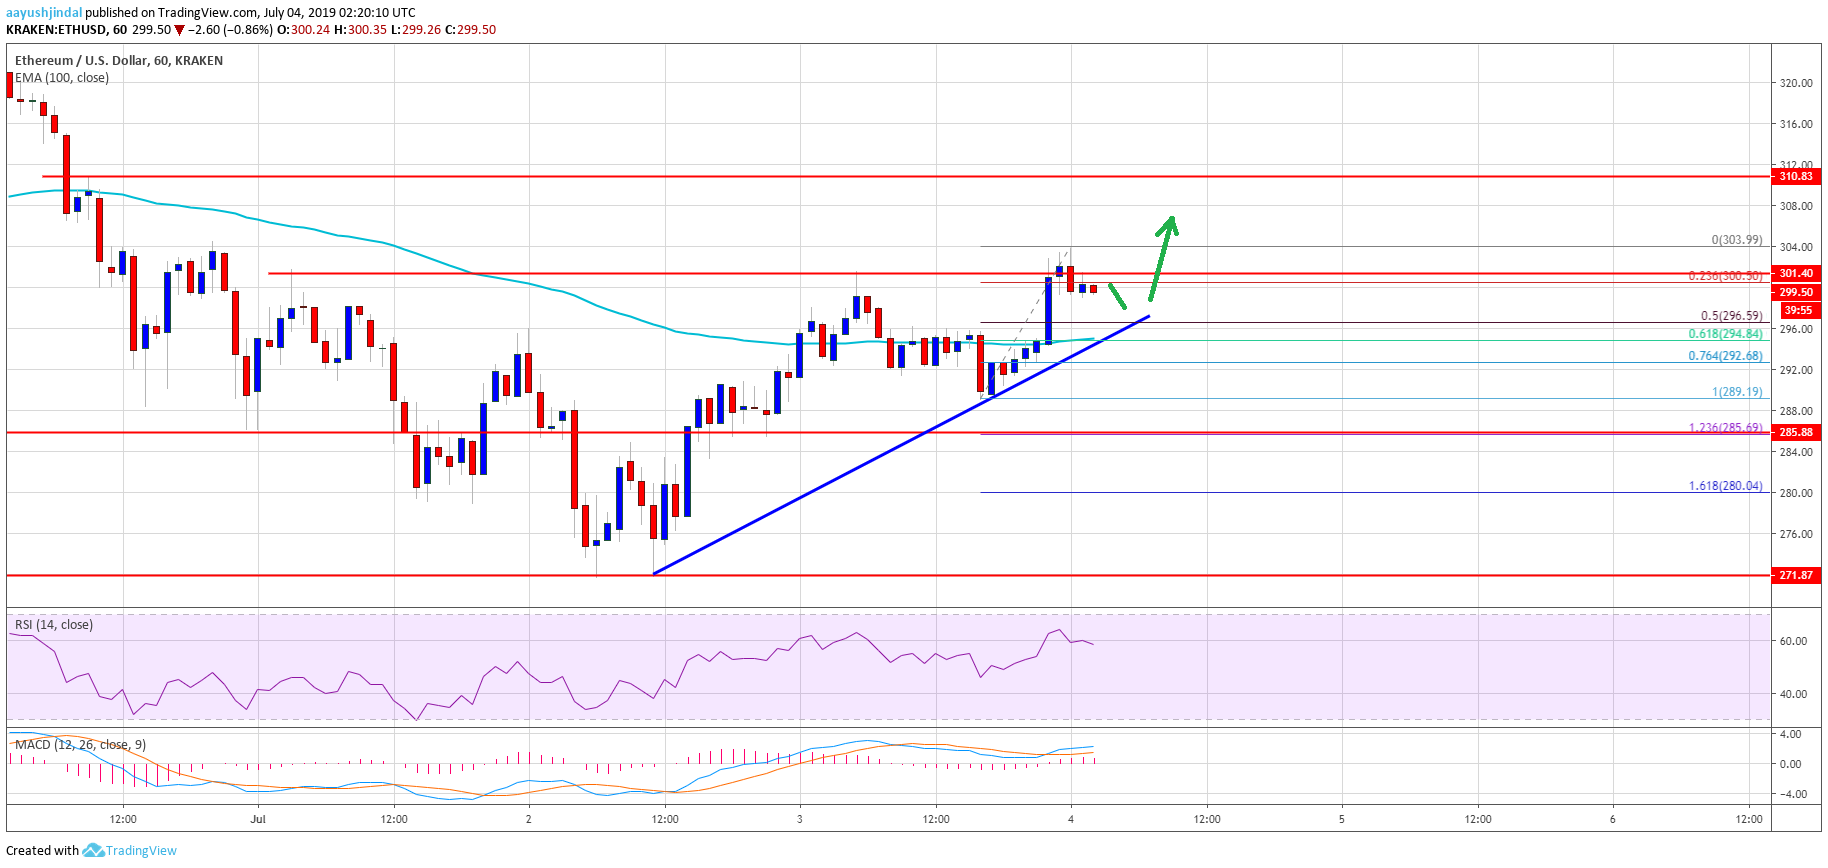
- ETH price made a few attempts to settle above the $300 resistance area against the US Dollar.
- It is currently consolidating near $300 and it might rise above $305 and $306 in the near term.
- There is a new connecting bullish trend line forming with support near $297 on the hourly chart of ETH/USD (data feed via Kraken).
- If there is a downside break below $295, the price could revisit the $285 support area.
Ethereum price is showing positive signs above $295 versus the US Dollar, but struggling vs bitcoin. ETH price might accelerate gains once it settles above the $300 and $305 levels.
Ethereum Price Analysis
There were extended gains in bitcoin above the $11,500 level, but Ethereum struggled against the US Dollar. Earlier, the ETH/USD pair made a few attempts to settle above the $300 resistance area. Finally, there was an upside break, but there was no momentum above the $300 level. The price traded to a new intraday high near $304 and settled above the 100 hourly simple moving average.
It is currently correcting gains and is trading near the $300 level. The 23.6% Fib retracement level of the recent wave from the $290 swing low to $304 high is also near the $300 level. If there are more downsides, the price might test the $296-297 support area. Moreover, there is a new connecting bullish trend line forming with support near $297 on the hourly chart of ETH/USD.
Below the trend line, the next key support is near the $295 level. The 50% Fib retracement level of the recent wave from the $290 swing low to $304 high is also near the $295 level. Finally, the 100 hourly SMA is likely to act as a strong support near $295. As long as there is no close below $295 and the 100 hourly SMA, there are chances of more upsides in the near term.
On the upside, an immediate resistance is near the $304-305 zone. If there is an upside break above $305, the price could test the $310 resistance area. Any further gains could lead the price towards the key $325 resistance area.
Looking at the chart, Ethereum price is clearly showing a few positive signs above the $295 support area. If bitcoin price continues to rise and breaks the $12,000 resistance, there could be more gains in ETH/USD above the $305 and $310 resistance levels.
ETH Technical Indicators
Hourly MACD – The MACD for ETH/USD is currently showing positive signs in the bullish zone.
Hourly RSI – The RSI for ETH/USD is currently well above the 50 level, but it is correcting lower.
Major Support Level – $295
Major Resistance Level – $305


