
Reason to trust
How Our News is Made
Strict editorial policy that focuses on accuracy, relevance, and impartiality
Ad discliamer
Morbi pretium leo et nisl aliquam mollis. Quisque arcu lorem, ultricies quis pellentesque nec, ullamcorper eu odio.
- ETH price gained momentum and traded to a new monthly high at $210 against the US Dollar.
- The price corrected lower, but it remains well supported on the downside near $192.
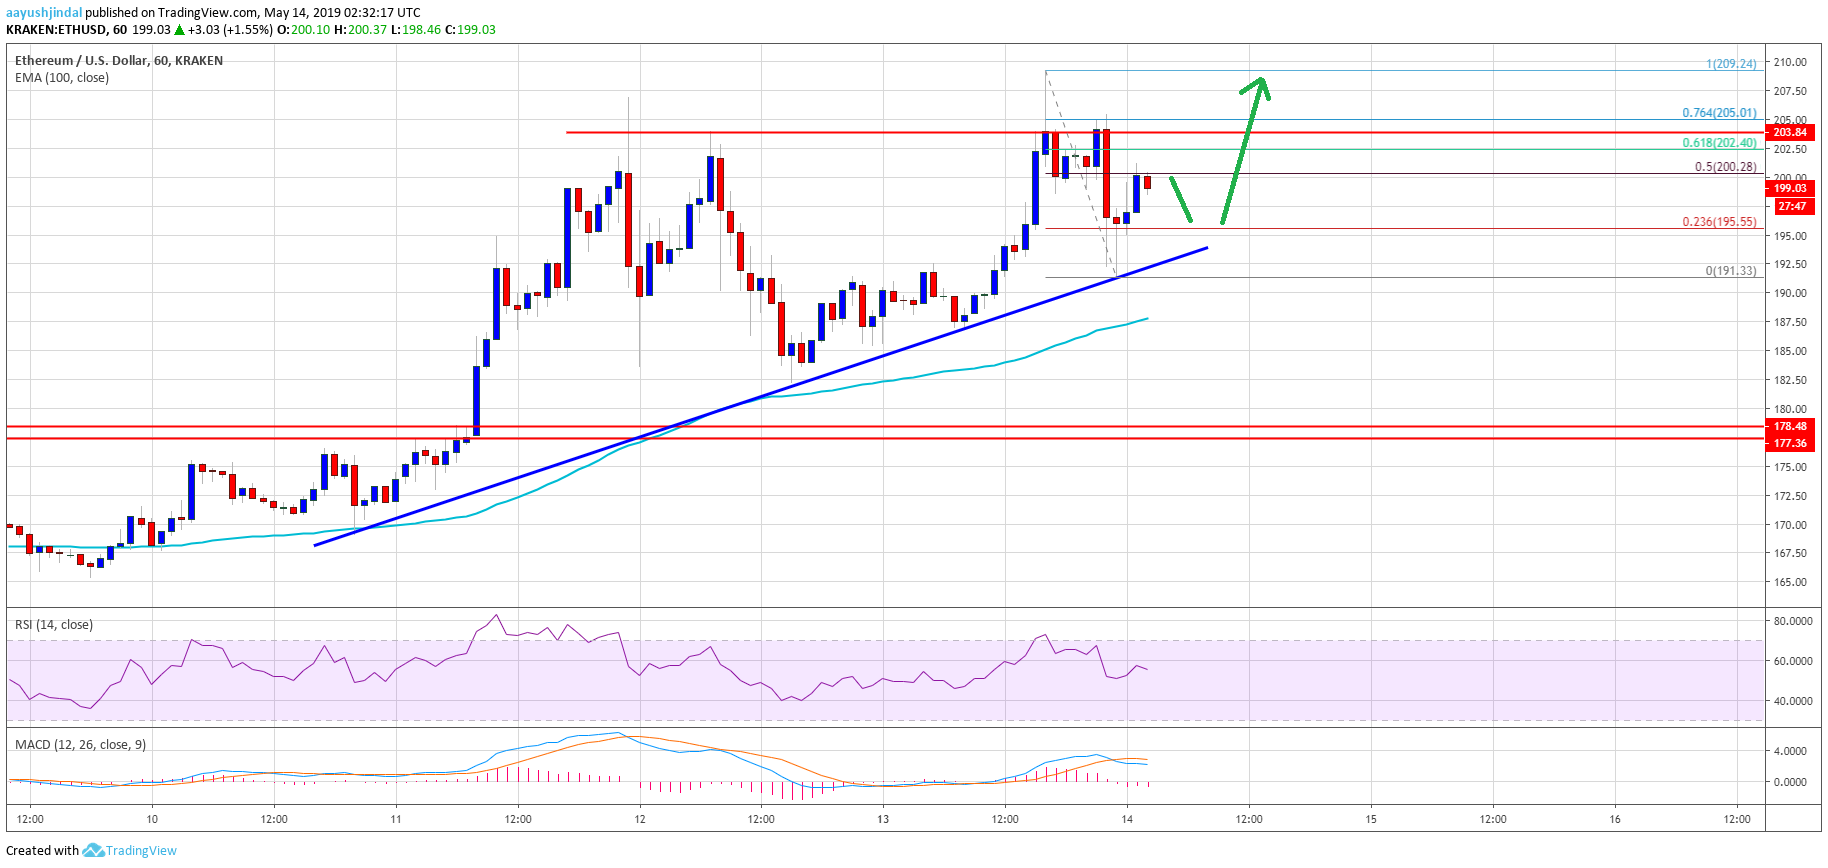
- Yesterday’s highlighted key bullish trend line is active with support near $192 on the hourly chart of ETH/USD (data feed via Kraken).
- The pair is likely to climb above the $205 and $210 resistance levels in the near term.
Ethereum price climbed above $200 once again versus the US Dollar after bitcoin broke $8,000. ETH price is in a nice uptrend and it may soon break the $210 swing high.
Ethereum Price Analysis
In the past three sessions, Ethereum price gained momentum above the $192 and $195 resistances against the US Dollar. The ETH/USD pair even broke the $200 resistance level and settled well above the 100 hourly simple moving average. The main driving force was bitcoin, climbing above the $7,800 and $8,000 resistance levels. Ether too gained traction and traded to a new monthly high above the $205 level. A swing high was formed near $210 before the price corrected lower.
It traded below the $205 and $200 levels, but the bulls remained in control. The price tested the $192 level and it is currently moving higher. An immediate resistance is $200, and the 50% Fib retracement level of the recent drop $210 high to $192 low. However, the main resistance is near the $204 level. If there is a proper close above $204, the price might break $205. The $205 level represents the 76.4% Fib retracement level of the recent drop $210 high to $192 low. The next resistance is near $210, above which the price is likely to climb higher towards $220.
If there are further gains, the price is likely surge higher towards the $230 level. On the downside, there is a decent support is near the $195 and $192 levels. Moreover, yesterday’s highlighted key bullish trend line is active with support near $192 on the hourly chart of ETH/USD. The key support is near $185 and the 100 hourly SMA.
Looking at the chart, Ethereum price is slowly gaining traction above the $198 and $200 levels. A clear break above the $205 level is likely to set the pace for more gains above the $220 level in the near term. If there is a downside correction, the price is likely to find bids near the $195 and $192 levels.
ETH Technical Indicators
Hourly MACD – The MACD for ETH/USD is about to gain traction in the bullish zone.
Hourly RSI – The RSI for ETH/USD is currently well above the 50 level, with a positive bias.
Major Support Level – $192
Major Resistance Level – $205


