
Reason to trust
How Our News is Made
Strict editorial policy that focuses on accuracy, relevance, and impartiality
Ad discliamer
Morbi pretium leo et nisl aliquam mollis. Quisque arcu lorem, ultricies quis pellentesque nec, ullamcorper eu odio.
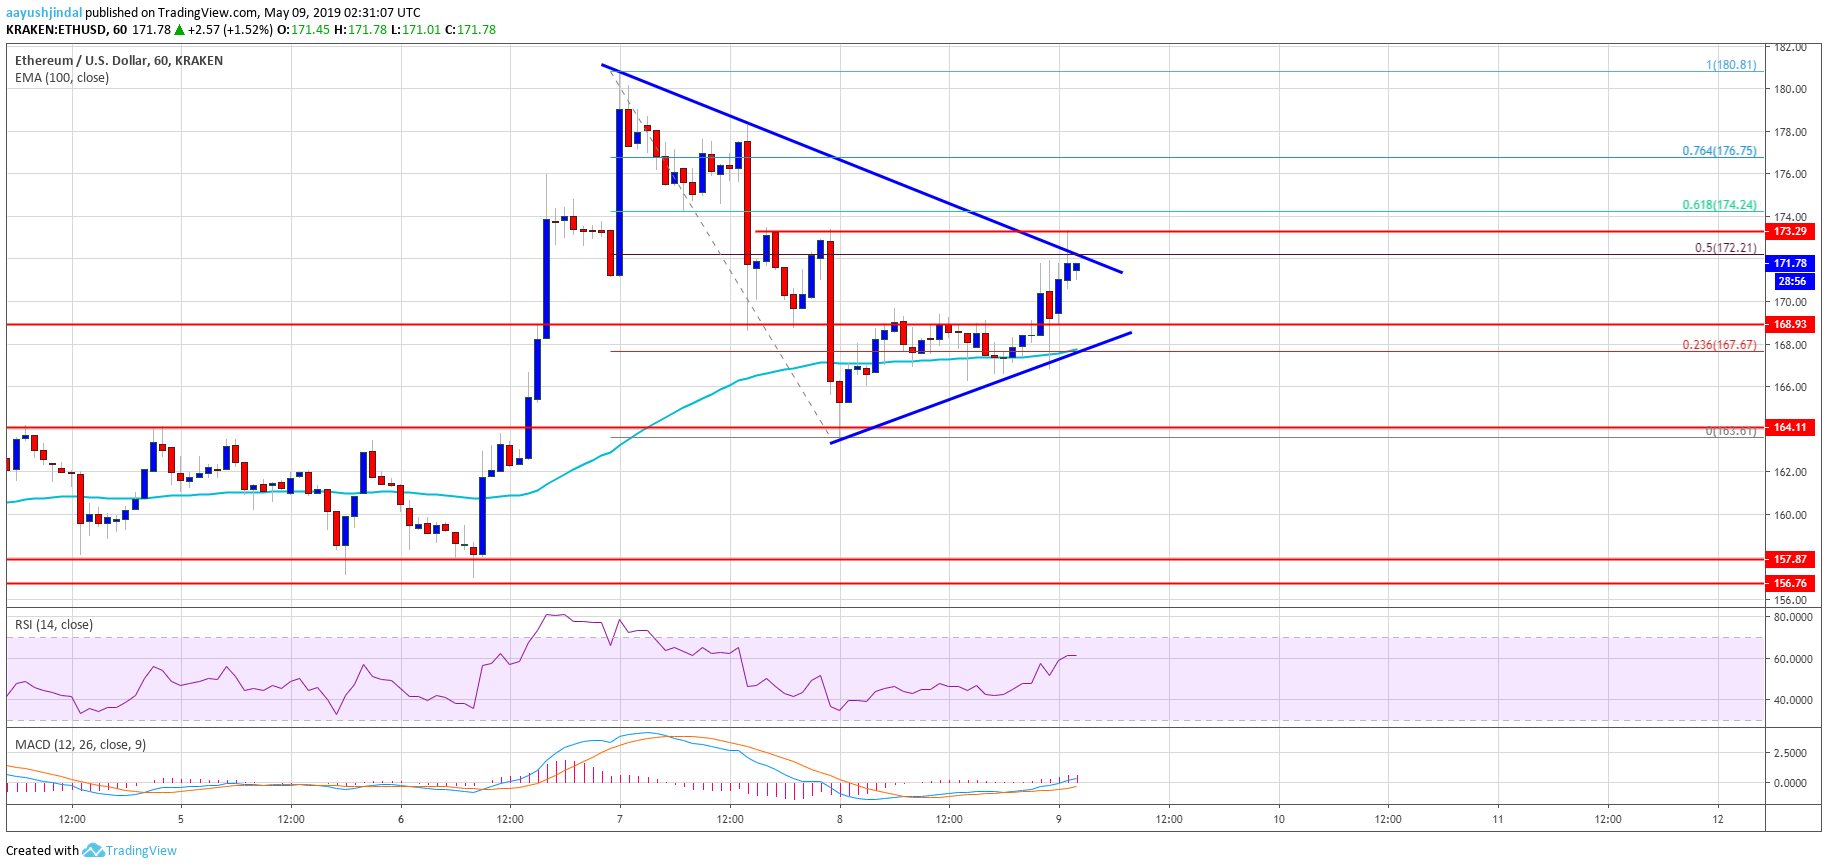
- ETH price found support near the $164-165 area and bounced back against the US Dollar.
- The price broke the $168 and $169 resistance levels, and is currently gathering momentum.
- There is a breakout pattern forming with resistance at $172 on the hourly chart of ETH/USD (data feed via Kraken).
- The pair is likely to break the $172 resistance and climb towards the $176 and $180 resistance levels.
Ethereum price is gaining bullish momentum versus the US Dollar, following bitcoin price rise. ETH is now placed above $169 and it looks set for more gains towards the $180 level.
Ethereum Price Analysis
Yesterday, we saw a downside correction in Ethereum price below the $169 support against the US Dollar. The ETH/USD pair even broke the $168 level and the 100 hourly simple moving average. It tested the key $164-165 support area, where buyers emerged. A swing low was formed near $164 and the price started a fresh rise. It broke the $168 resistance and the 100 hourly SMA. Besides, there was a break above the 23.6% Fib retracement level of the last slide from the $180 high to $164 low.
The price is now trading above the $170 level and the 100 hourly SMA. However, it is facing a strong resistance near the $172 level. There is also a breakout pattern forming with resistance at $172 on the hourly chart of ETH/USD. Moreover, the 50% Fib retracement level of the last slide from the $180 high to $164 low is also acting as a resistance near the $172 level. Therefore, a successful break above the $172 resistance is likely to open the gates for more gains in the near term.
The next key resistance is near $176, above which the price may test the $180 level. Bitcoin price recently surged above the $6,080 level, and it seems like it could help Ether as well. If there is a downside correction, the $168 level and the 100 hourly SMA may act as a support. A close below the $168 support might start a slide towards the $164 support.
Looking at the chart, Ethereum price seems to be gaining pace above $170. However, the bulls need to clear the $172 resistance level to set the stage for a push towards the $180 level. There are even chances of a fresh high above $180 if the bulls remain in action for the next few sessions.
ETH Technical Indicators
Hourly MACD – The MACD for ETH/USD is gaining pace in the bullish zone, with a positive bias.
Hourly RSI – The RSI for ETH/USD climbed back above the 50 level and it is currently near the 60 level.
Major Support Level – $168
Major Resistance Level – $172


