
Reason to trust
How Our News is Made
Strict editorial policy that focuses on accuracy, relevance, and impartiality
Ad discliamer
Morbi pretium leo et nisl aliquam mollis. Quisque arcu lorem, ultricies quis pellentesque nec, ullamcorper eu odio.
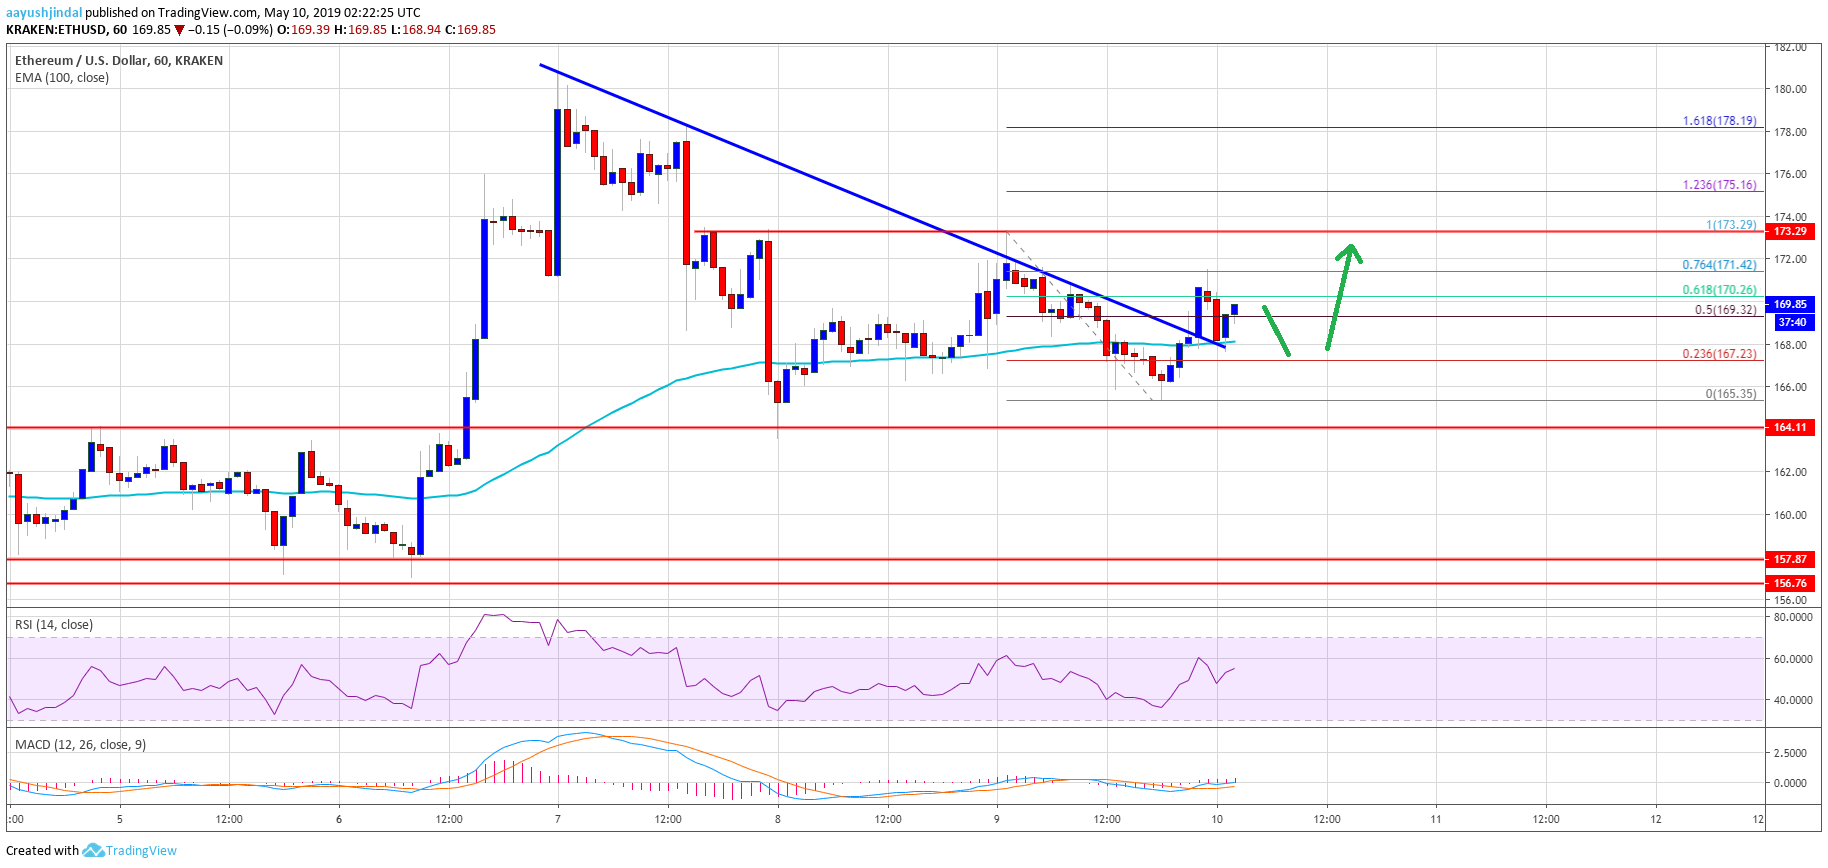
- ETH price remains supported above the $164 level and recently recovered against the US Dollar.
- The price is still struggling to clear the $172 and $173 resistance levels, despite gains in bitcoin.
- There was a break above a key bearish trend line with resistance at $168 on the hourly chart of ETH/USD (data feed via Kraken).
- The pair could trade in a range before it makes an attempt to break the $172 and $175 resistance levels.
Ethereum price is trading sideways with positive signs versus the US Dollar, but declined further vs bitcoin. ETH remains supported above $164 and it might soon climb above $172 and $175.
Ethereum Price Analysis
In the past three sessions, there were mostly range moves in Ethereum price above $164 against the US Dollar. The ETH/USD pair slowly moved higher and broke the $168 resistance and the 100 hourly simple moving average. There was also a break above the $170 level, but the price struggled near $173 plus the 50% Fib retracement level of the downside move from the $180 high to $164 low. The price retreated from the $173 swing high and revisited the $165 support area.
Recently, it bounced back above $168 and the 100 hourly SMA. Moreover, there was a break above a key bearish trend line with resistance at $168 on the hourly chart of ETH/USD. The pair traded above the 61.8% Fib retracement level of the recent slide from the $173 high to $165 low. However, the bulls seem to be struggling to gain bullish momentum above $172 and $173. ETH price is currently trading in a range and it could even dip a few points towards the $167 or $165 support.
To start a solid upward move, the price must clear the $172 and $173 levels. However, the main resistance is near $175, above which the price could trade towards the $180 resistance level. On the downside, an initial support is at $167, below which the price might retest the $165 support level.
Looking at the chart, Ethereum price seems to be trading in a range below the $172 resistance area. There could be a couple of swing moves, but considering the recent rally in BTC, ETH could also start a decent upward move above $172 and $175. A successful close above the $175 level is likely to open the gates for a strong push towards the $180 and $185 resistance levels.
ETH Technical Indicators
Hourly MACD – The MACD for ETH/USD is mostly flat in the bullish zone.
Hourly RSI – The RSI for ETH/USD moved above the 50 level and it is currently near the 54 level.
Major Support Level – $165
Major Resistance Level – $172


