
Reason to trust
How Our News is Made
Strict editorial policy that focuses on accuracy, relevance, and impartiality
Ad discliamer
Morbi pretium leo et nisl aliquam mollis. Quisque arcu lorem, ultricies quis pellentesque nec, ullamcorper eu odio.
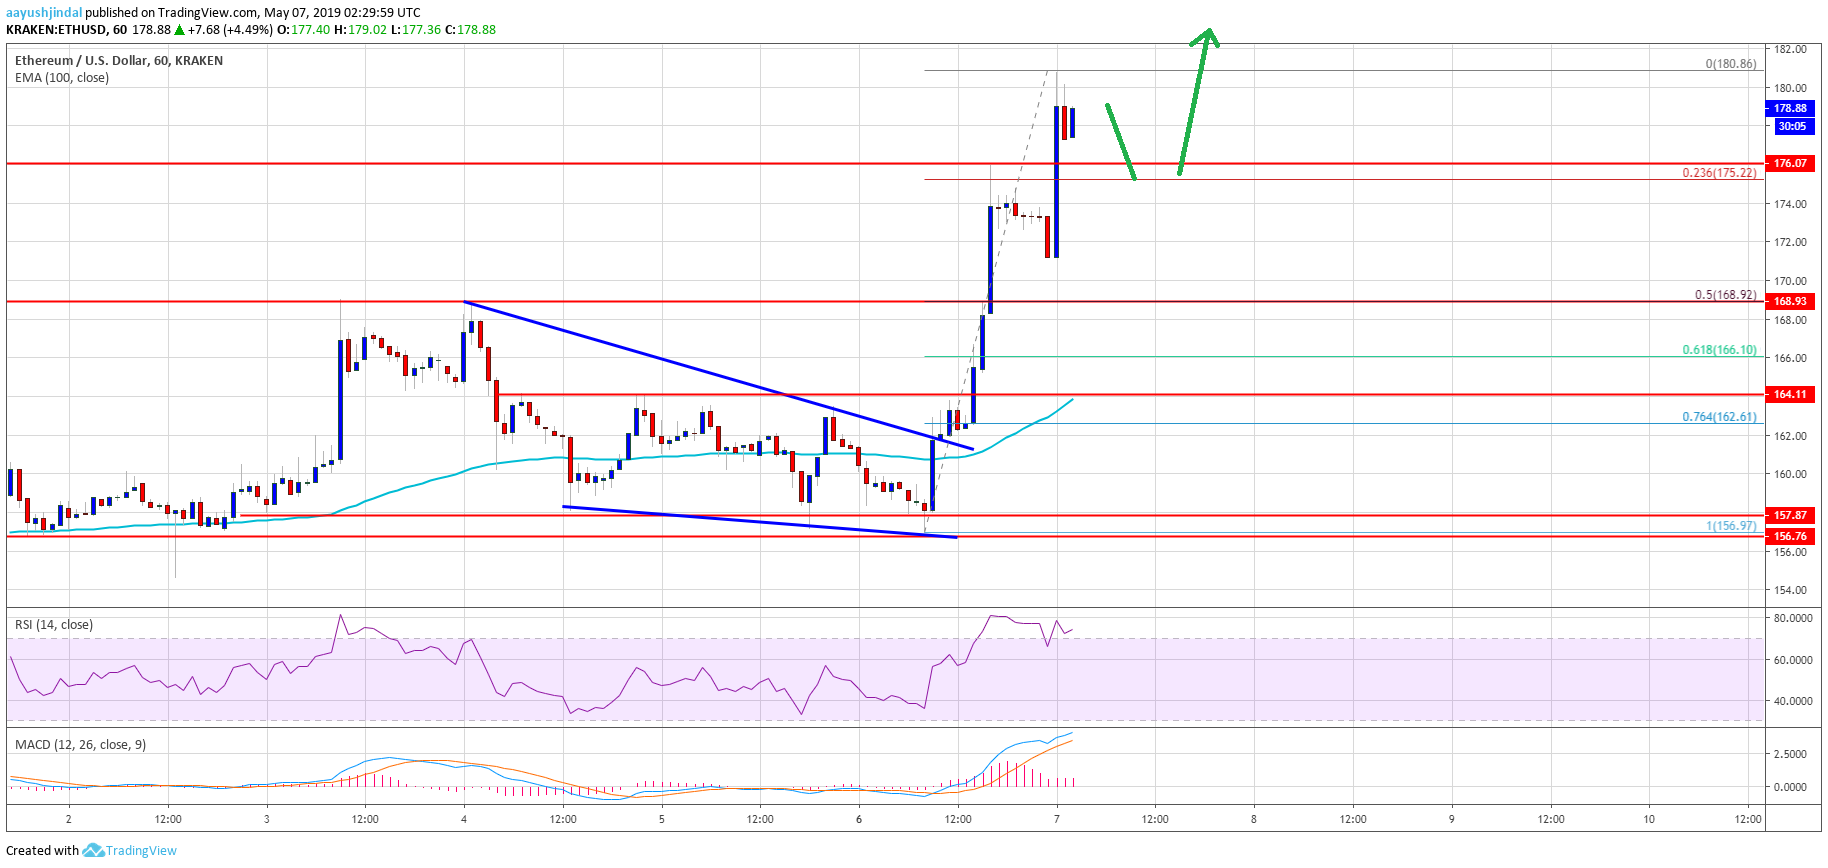
- ETH price rebounded nicely after testing the key $160 support area against the US Dollar.
- The price climbed higher sharply and broke the $165, $168 and $170 resistance levels.
- There was a break above a contracting triangle with resistance near $162 on the hourly chart of ETH/USD (data feed via Kraken).
- The pair traded to a new weekly high near $180 and it remains well supported for more gains.
Ethereum price started a strong upward move versus the US Dollar and bitcoin. ETH is likely to remain in an uptrend and it could even target a break above the $185 and $192 resistances.
Ethereum Price Analysis
Yesterday, we saw a downside extension in Ethereum price below the $165 level against the US Dollar. The ETH/USD pair tested the key $160 support area, where the bulls defended more losses. As a result, there was a strong upward move and the price climbed back above the $162 and $165 resistance levels. There was a change in the trend, with a close above the $165 level and the 100 hourly simple moving average.
During the rise, there a break above a contracting triangle with resistance near $162 on the hourly chart of ETH/USD. The pair rallied above the $165, $168 and $170 resistance levels. It even cleared $175 and traded to a new weekly high near the $180 level. At the moment, the price is consolidating gains above the $175 level. An immediate support is near $175, and the 23.6% Fib retracement level of the recent wave from the $160 low to $180 high. If there is a downside extension, the price could test the key $169 support level.
The mentioned $169 level was a resistance recently and it may now provide support. The 50% Fib retracement level of the recent wave from the $160 low to $180 high is also near the $169 level. On the upside, the main resistance is near the $180-181 zone. A clear close above $180 may open the doors for a push above the $185 and $192 resistance levels.
Looking at the chart, Ethereum price clearly jumped sharply from the $160 support area. The current price action is positive and it seems like the price may continue to rise above the $180 resistance level. The bulls may even target the main $200 level in the coming days. On the downside, the recent barriers are likely to act as supports such as $175, $170 and $169.
ETH Technical Indicators
Hourly MACD – The MACD for ETH/USD is currently reducing its bullish slope, with positive signs.
Hourly RSI – The RSI for ETH/USD is currently well above the 70 level, with a strong bullish bias.
Major Support Level – $169
Major Resistance Level – $180


