
Reason to trust
How Our News is Made
Strict editorial policy that focuses on accuracy, relevance, and impartiality
Ad discliamer
Morbi pretium leo et nisl aliquam mollis. Quisque arcu lorem, ultricies quis pellentesque nec, ullamcorper eu odio.
- ETH price extended losses and traded below the $170 support level against the US Dollar.
- Sellers gained momentum and pushed the price towards the $160 support level.
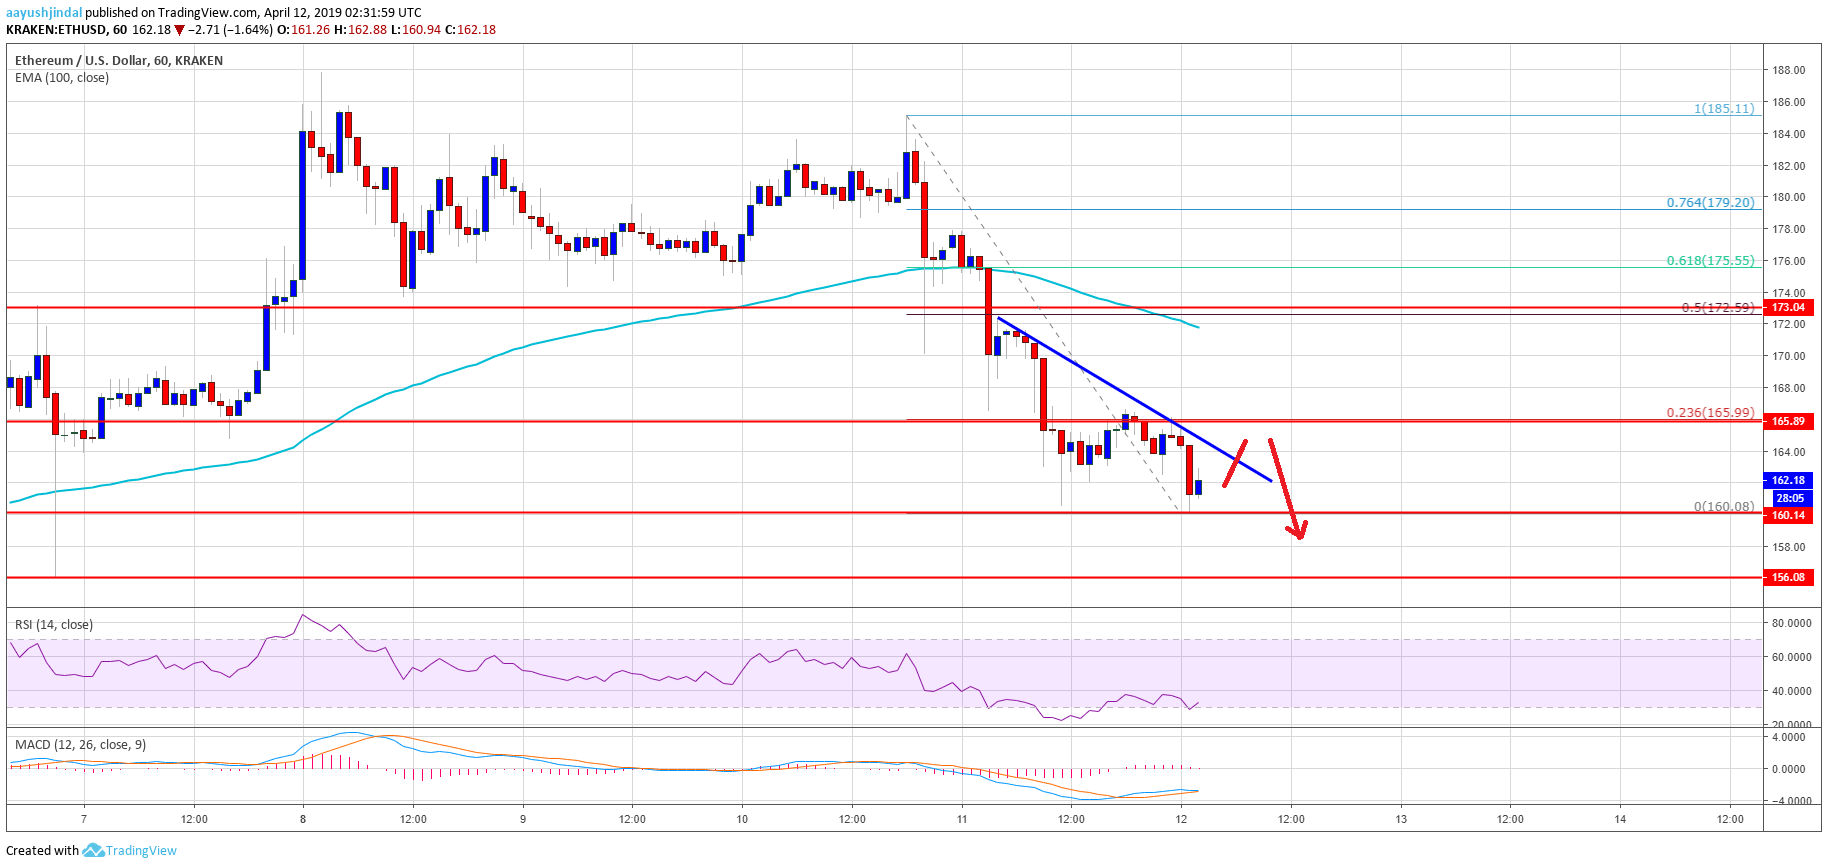
- There is a key bearish trend line in place with resistance at $164 on the hourly chart of ETH/USD (data feed via Kraken).
- The pair could continue to move down and it is likely to test the key $155 support area in the near term.
Ethereum price struggled recently and declined heavily versus the US Dollar and bitcoin. ETH is likely to test the key $155 support level, where buyers are likely to appear.
Ethereum Price Analysis
After struggling near the $185 resistance, Ethereum price started a downside correction against the US Dollar. The ETH/USD pair gained bearish momentum and broke the $175 and $170 support levels. Recently, there was an increase in selling pressure and the price broke the $165 support and the 100 hourly simple moving average. It resulted in additional losses and the price moved toward the $160 support area. It is currently consolidating losses above $160, with a bearish angle.
On the upside, an initial resistance is near the $164 level and the 23.6% Fib retracement level of the last slide from the $185 high to $160 low. There is also a key bearish trend line in place with resistance at $164 on the hourly chart of ETH/USD. The $165 level is also a significant resistance since it was a support earlier. If there is a break above the $165 level, the price could rebound towards the $172 level. It represents the 50% Fib retracement level of the last slide from the $185 high to $160 low. Besides, the 100 hourly SMA is also near the $172 level.
On the downside, the $160 might continue to hold losses. However, there are chances of another downside push towards the $155 support. The stated $155 support is very important and it is likely to hold losses. If buyers fail near $155, the next stop for sellers could be $142 in the near term.
Looking at the chart, Ethereum price clearly corrected sharply below the $170 and $165 support levels. The last line of defense is near the $155 level, where buyers are likely to take a stand. In order to start a decent rebound, the price must move above the $165 and $172 resistance levels. In the mentioned case, the price could revisit the $185 resistance.
ETH Technical Indicators
Hourly MACD – The MACD for ETH/USD is slowly moving in the bearish zone.
Hourly RSI – The RSI for ETH/USD is now well below the 50 level and it is currently near 32.
Major Support Level – $155
Major Resistance Level – $172


