
Reason to trust
How Our News is Made
Strict editorial policy that focuses on accuracy, relevance, and impartiality
Ad discliamer
Morbi pretium leo et nisl aliquam mollis. Quisque arcu lorem, ultricies quis pellentesque nec, ullamcorper eu odio.
Ethereum started a fresh increase from the $235 zone against the US Dollar. ETH price is now trading nicely above $240, but it is still struggling to gain momentum above $245 and $250.
- Ethereum is trading well above the $240 support and the 100 hourly simple moving average.
- The price must surpass the $245 and $250 resistance levels to continue higher.
- There was a break above a key bearish trend line with resistance near $242 on the hourly chart of ETH/USD (data feed via Kraken).
- The pair could dip in the short term, but the $240 zone is likely to provide support.
Ethereum Price Showing Positive Signs
Ethereum price extended its decline below the $240 support level. ETH price traded close to the $235 level before the bulls took a stand. A low is formed near $234 and the price recently recovered sharply.
There was a break above the $240 resistance zone and the 100 hourly simple moving average. There was a break above a key bearish trend line with resistance near $242 on the hourly chart of ETH/USD.
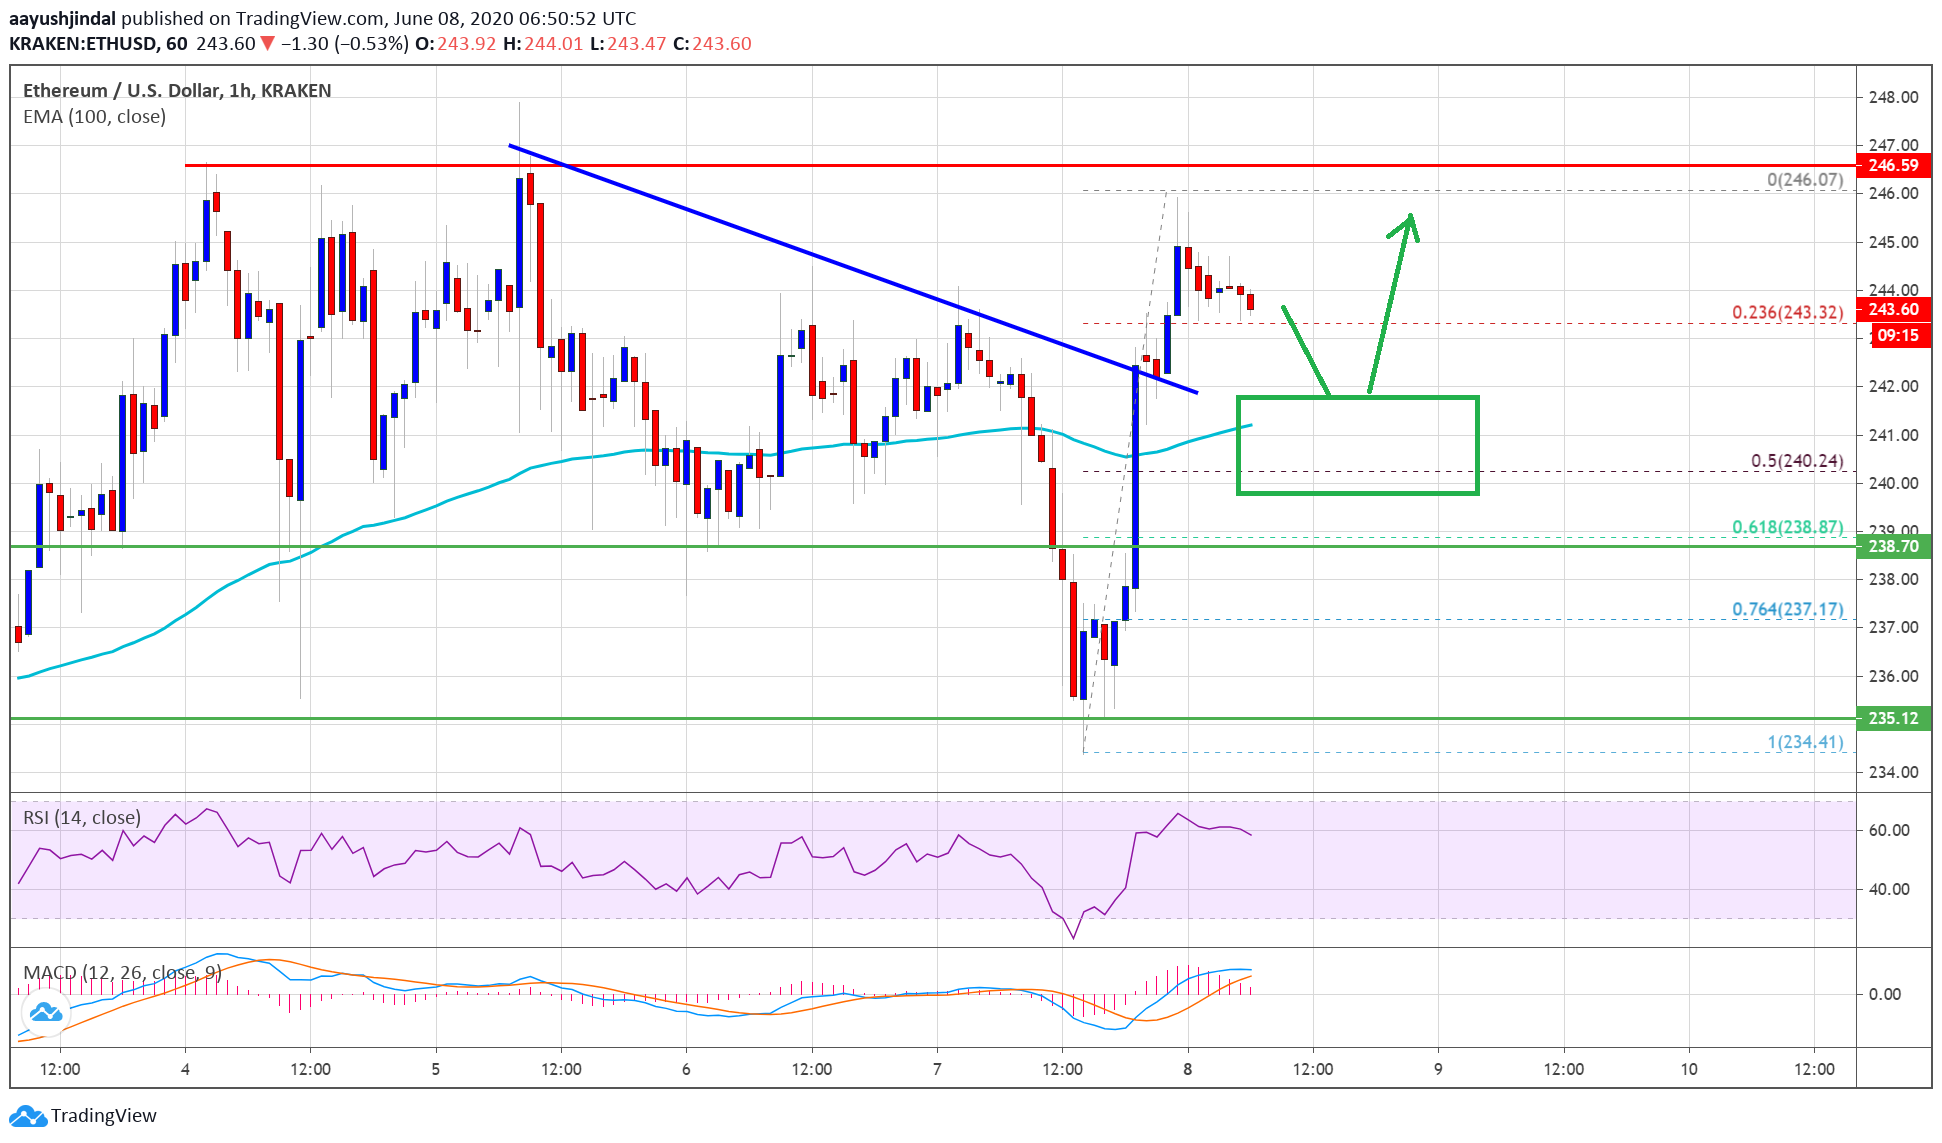
However, ether price again struggled to gain strength above the $245 resistance. A high is formed near $246 and the price is currently correcting lower. It tested the 23.6% Fib retracement level of the recent wave from the $234 low to $246 high.
The first major support on the downside is near the $242 level and the 100 hourly simple moving average. The next key support is near the $240 level and the 50% Fib retracement level of the recent wave from the $234 low to $246 high.
On the upside, the bulls need to gain strength above the $245 and $250 resistance levels to start a strong increase. The next major barrier could be near the $260 and $262 levels.
Dips Supported in ETH
If Ethereum fails to continue higher above $245, it could react to the downside. The main support is near the $240 level and the 100 hourly simple moving average.
If the price settles below $240, there is a risk of another test of the $230 support. Any further losses could lead the price towards the $220 support zone.
Technical Indicators
Hourly MACD – The MACD for ETH/USD is losing momentum in the bullish zone.
Hourly RSI – The RSI for ETH/USD is currently well above the 50 level.
Major Support Level – $240
Major Resistance Level – $250
Take advantage of the trading opportunities with Plus500
Risk disclaimer: 76.4% of retail CFD accounts lose money.


