
Reason to trust
How Our News is Made
Strict editorial policy that focuses on accuracy, relevance, and impartiality
Ad discliamer
Morbi pretium leo et nisl aliquam mollis. Quisque arcu lorem, ultricies quis pellentesque nec, ullamcorper eu odio.
Ethereum is currently correcting lower from the $176 monthly high against the US Dollar. ETH price remains well supported on the downside near the $162 and $158 levels.
- Ethereum is correcting lower and trading below the $170 level against the US Dollar, similar to bitcoin.
- The price is holding the main $162 and $158 support levels.
- There is a key contracting triangle forming with resistance near $170 on the hourly chart of ETH/USD (data feed via Kraken).
- The pair could rally again towards $180 as long as there is no close below the $158 support.
Ethereum Price Remains in Uptrend
Yesterday, we saw a sharp rise in Ethereum above the $160 and $170 levels against the US Dollar. However, ETH price struggled to clear the $175 resistance and the 100-day simple moving average (as discussed in yesterday’s analysis).
A new monthly high is formed near the $176 level and the price recently corrected lower. It broke the $170 level to start the correction. There was a break below the 23.6% Fib retracement level of the upward move from the $140 swing low to $176 high.
On the downside, the $162 level is acting as a strong support and Ethereum is trading well above the 100 hourly simple moving average. There is also a key contracting triangle forming with resistance near $170 on the hourly chart of ETH/USD.
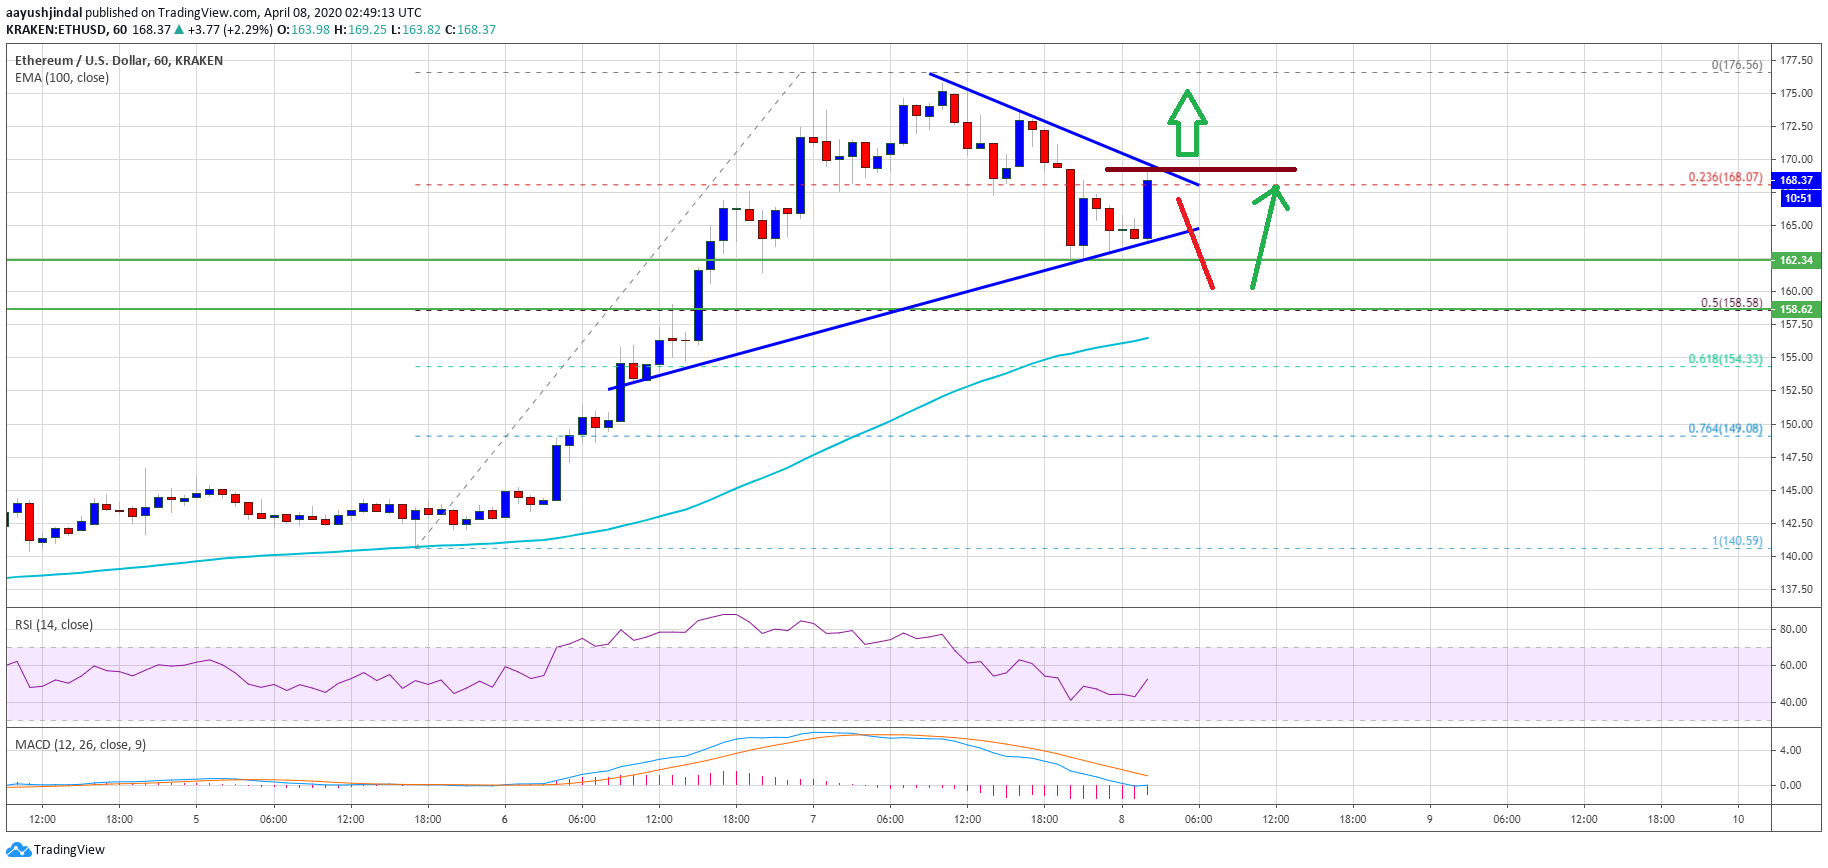
If there is an upside break above the triangle resistance and $170, the price is likely to restart its rise. An immediate resistance is near the $175 level, above which the price could surge towards the $180 level. Any further gains could lead the price towards the $188 level.
Key Buy Zones
On the downside, Ethereum is likely to remain well supported above the $162 levels. The next major support is near the $158 level. It coincides with the 50% Fib retracement level of the upward move from the $140 swing low to $176 high.
The 100 hourly simple moving average is also near the $155 level to act as a strong support. If the price fails to stay above the $158 support and the 100 hourly SMA, it could extend its decline towards the $150 and $144 levels in the near term.
Technical Indicators
Hourly MACD – The MACD for ETH/USD is slowly moving in the bullish zone.
Hourly RSI – The RSI for ETH/USD is currently declining and approaching the 50 level.
Major Support Level – $140
Major Resistance Level – $145
Take advantage of the trading opportunities with Plus500
Risk disclaimer: 76.4% of retail CFD accounts lose money.


