
Reason to trust
How Our News is Made
Strict editorial policy that focuses on accuracy, relevance, and impartiality
Ad discliamer
Morbi pretium leo et nisl aliquam mollis. Quisque arcu lorem, ultricies quis pellentesque nec, ullamcorper eu odio.
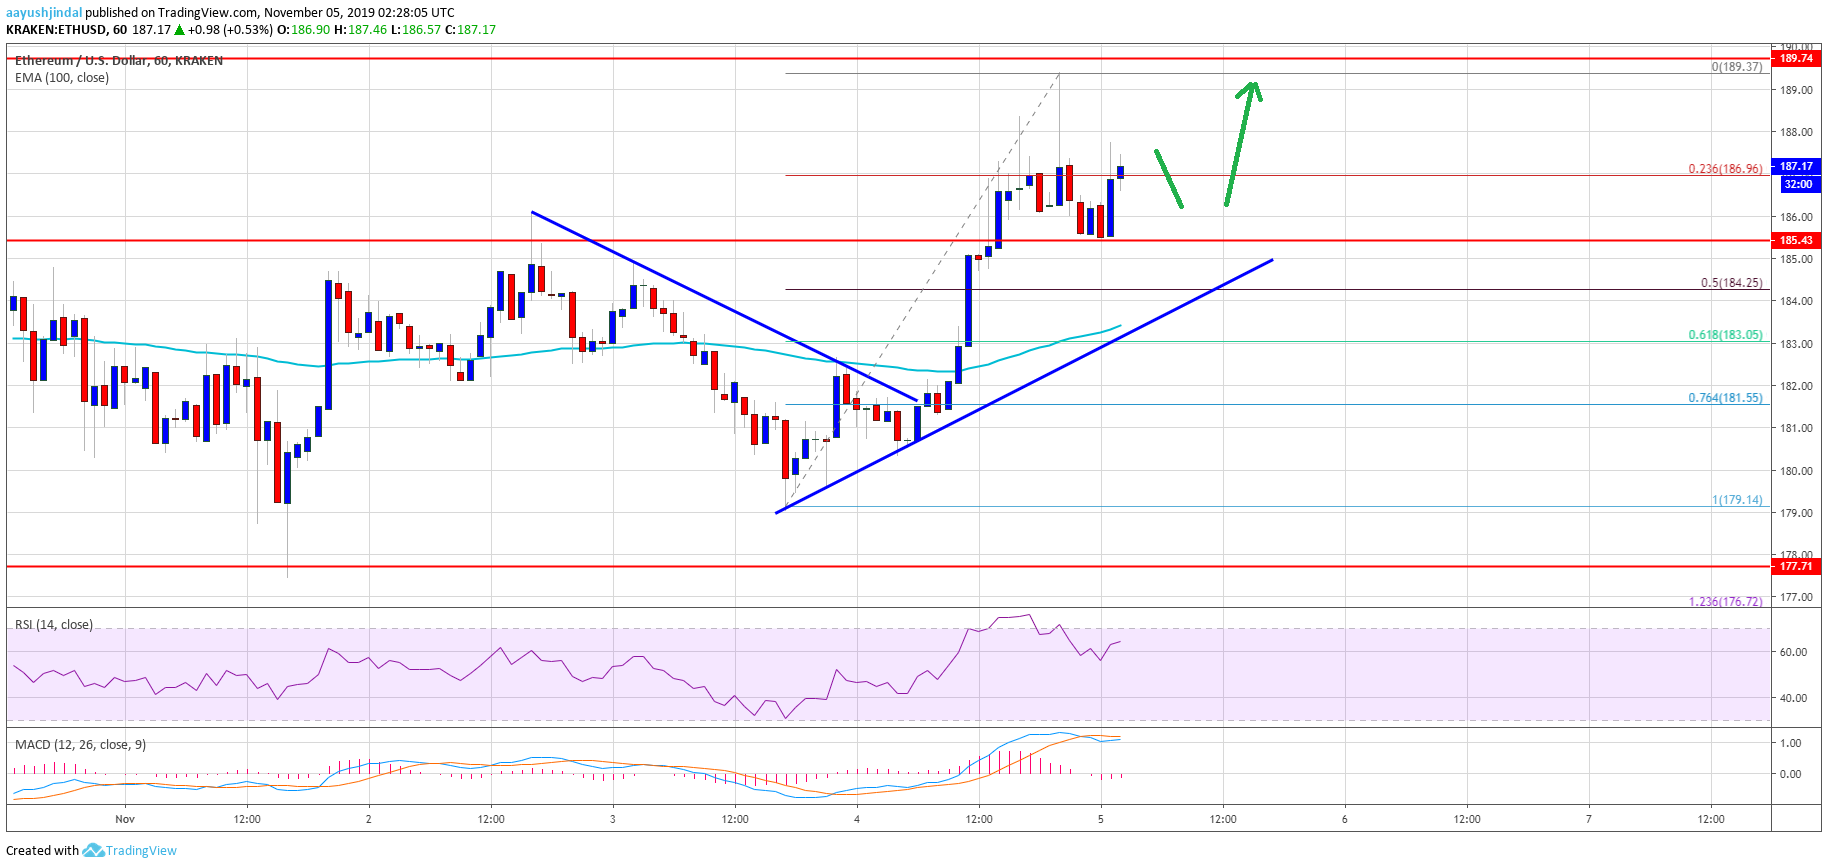
- Ethereum price is rising and it broke the key $185 and $186 resistance levels against the US Dollar.
- Bitcoin is up around 3% and it managed to climb above the $9,400 resistance.
- There is a new bullish trend line forming with support near $185 on the hourly chart of ETH/USD (data feed via Kraken).
- The pair remains supported on dips and it could continue to rise towards the $200 level in the near term.
Ethereum price is slowly climbing higher versus the US Dollar, similar to bitcoin. ETH price is likely to rise towards the $200 level as long as above $182.
Ethereum Price Analysis
After forming a support base near $180, Ethereum started a steady rise above $182 against the US Dollar. ETH price recovered and broke a strong resistance near the $185 and $186 levels.
Moreover, there was a close above the $185 level and the 100 hourly simple moving average. During the rise, there was a break above yesterday’s highlighted bearish trend line with resistance near $182.
Finally, the price tested the $190 resistance area and it is currently correcting lower. There was a break below the $188 level, plus the 23.6% Fib retracement level of the recent wave from the $179 swing low to $189 swing high.
However, the previous resistance near the $185 area is now acting as a decent support. More importantly, there is a new bullish trend line forming with support near $185 on the hourly chart of ETH/USD.
The 50% Fib retracement level of the recent wave from the $179 swing low to $189 swing high is also near the trend line to provide support. The main support is near the $182 level since it coincides with the 100 hourly SMA.
If Ethereum breaks the trend line and trades below $182, it could move back into a bearish zone. On the upside, an immediate resistance is near the $190 level. If there is a proper break above $190, the price could start an increase towards the main $200 resistance area.
Looking at the chart, Ethereum price is showing a few positive signs above the $185 support area. Having said that, the path towards the $200 barrier won’t be easy. If the bulls struggle to clear the $190 and $192 resistance levels, there could be a bearish reaction below the $185 support. In the mentioned case, the $182 support holds the key.
ETH Technical Indicators
Hourly MACD – The MACD for ETH/USD is about to move back into the bullish zone.
Hourly RSI – The RSI for ETH/USD is currently well above the 50 level, with positive signs.
Major Support Level – $182
Major Resistance Level – $190


