
Reason to trust
How Our News is Made
Strict editorial policy that focuses on accuracy, relevance, and impartiality
Ad discliamer
Morbi pretium leo et nisl aliquam mollis. Quisque arcu lorem, ultricies quis pellentesque nec, ullamcorper eu odio.
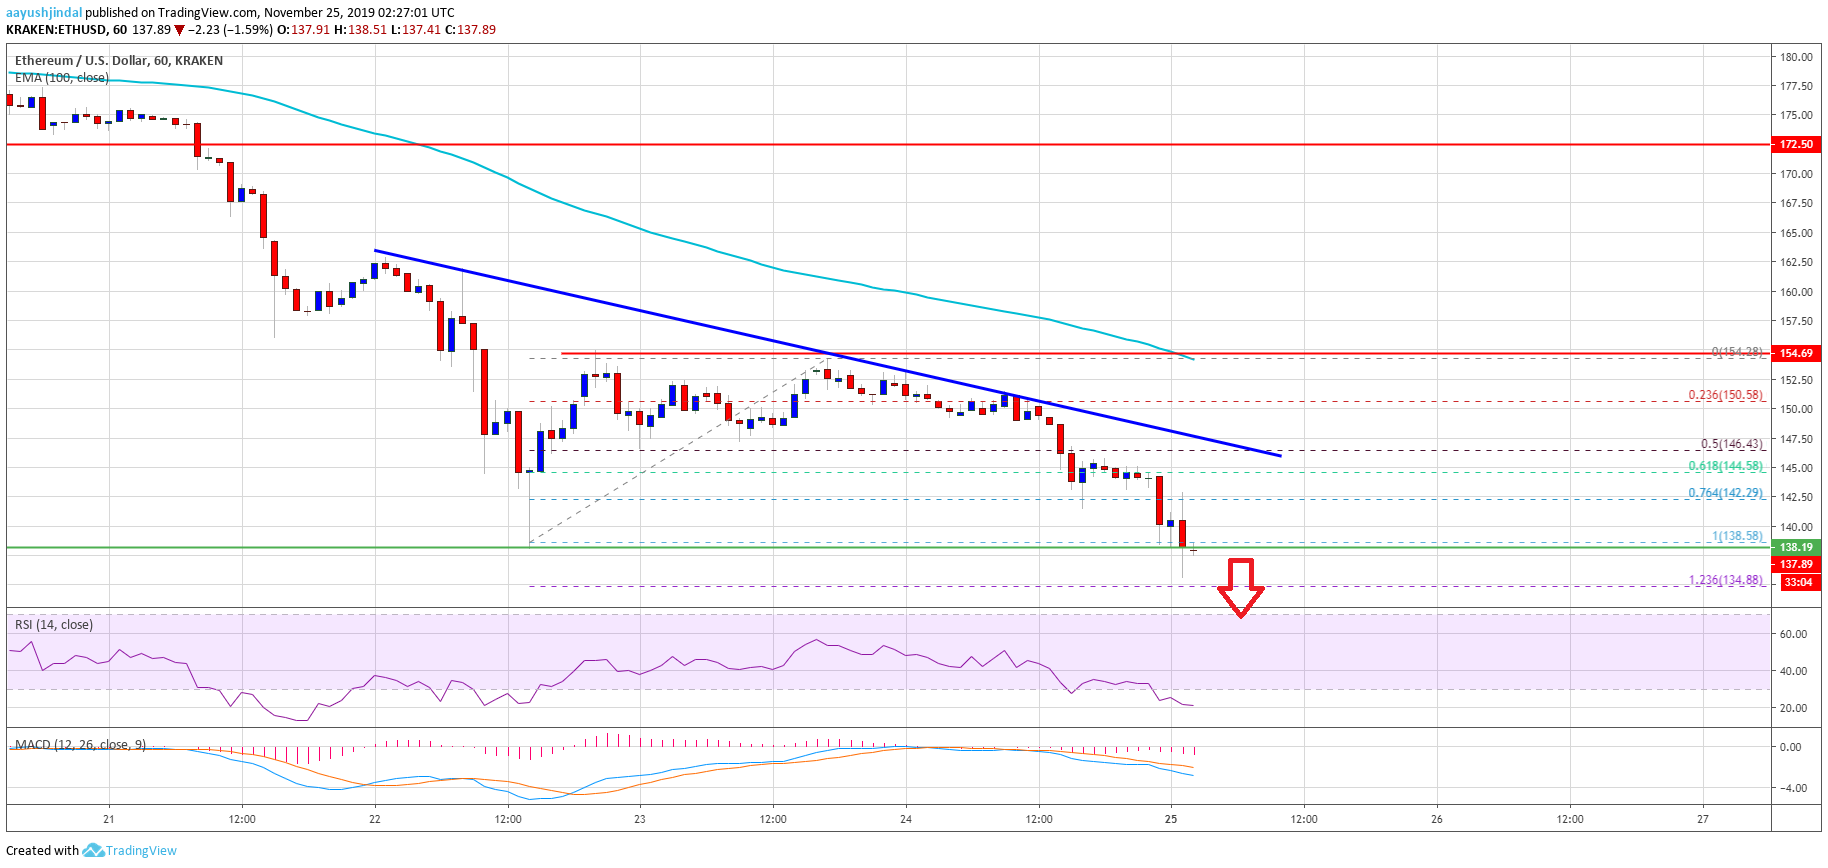
- Ethereum is declining and it recently failed to recover above the $155 resistance against the US Dollar.
- Bitcoin price is now trading well below the $7,000 level and tested the final $6,500 bearish target.
- There is a key bearish trend line forming with resistance near $147 on the hourly chart of ETH/USD (data feed via Kraken).
- The price is currently trading below $145 and it is likely to trade below the $135 support area.
Ethereum price is facing an increase in selling versus the US Dollar, similar to bitcoin. ETH remains at a risk of a drop towards the $125 support area.
Ethereum Price Analysis
In the weekly forecast, we discussed the chances of another breakdown below $145 in Ethereum against the US Dollar. ETH price remained in a bearish zone, failed to climb above the $155 resistance, and settled well below the 100 hourly simple moving average.
As a result, there was a downside break below the $145 support area. The decline was such that the price broke the 76.4% Fib retracement level of the recent recovery from the $138 low to $155 high.
Moreover, the price spiked below the $138 low and it is currently struggling to recover. An immediate support is near the $135 level. It represents the 1.236 Fib extension level of the recent recovery from the $138 low to $155 high.
If there are more downsides, the price is likely to test the $130 support area. Any further losses may perhaps push Ethereum towards the $125 support area in the near term. An intermediate support is near the 1.618 Fib extension level of the recent recovery from the $138 low to $155 high.
On the upside, there are many resistances, starting with $142. Additionally, there is a key bearish trend line forming with resistance near $147 on the hourly chart of ETH/USD.
To start a decent recovery, the price must clear the $142 and $147 resistance levels. However, the main resistance is still near the $155 level and the 100 hourly simple moving average, above which there are high chances of a trend change from bearish to bullish.
Looking at the chart, Ethereum price is declining and likely to trade towards the $135 and $130 support levels. The key support zone could be $125, where the bulls are likely to put up a strong fight in the near term.
ETH Technical Indicators
Hourly MACD – The MACD for ETH/USD is currently gaining momentum in the bearish zone.
Hourly RSI – The RSI for ETH/USD is currently declining and it is well near the oversold levels.
Major Support Level – $135
Major Resistance Level – $147


