
Reason to trust
How Our News is Made
Strict editorial policy that focuses on accuracy, relevance, and impartiality
Ad discliamer
Morbi pretium leo et nisl aliquam mollis. Quisque arcu lorem, ultricies quis pellentesque nec, ullamcorper eu odio.
Ethereum is trading nicely above the $175 support area against the US Dollar. ETH price is showing a lot of positive signs and it could continue to rise towards $188 and $195.
- Ethereum corrected lower and tested the main $175 support area.
- The price is currently rising and trading above the $180 pivot level.
- There is a major bullish trend line forming with support near $178 on the hourly chart of ETH/USD (data feed via SimpleFX).
- The pair is likely to accelerate higher once it clears the $185 and $188 resistance levels.
Ethereum Price Could Resume Uptrend
In the past few days, we saw a sharp rise in Ethereum above the $165 and $175 resistance levels against the US Dollar. ETH price even surpassed the $180 resistance and settled well above the 100 hourly simple moving average.
It traded to a new monthly high near $188 before starting a downside correction (similar to bitcoin). There was a correction below the $180 level, but the bulls were able to defend the key $175 support area.
It seems like there is a strong support base forming above the $175 level and the 100 hourly simple moving average. There is also a major bullish trend line forming with support near $178 on the hourly chart of ETH/USD.
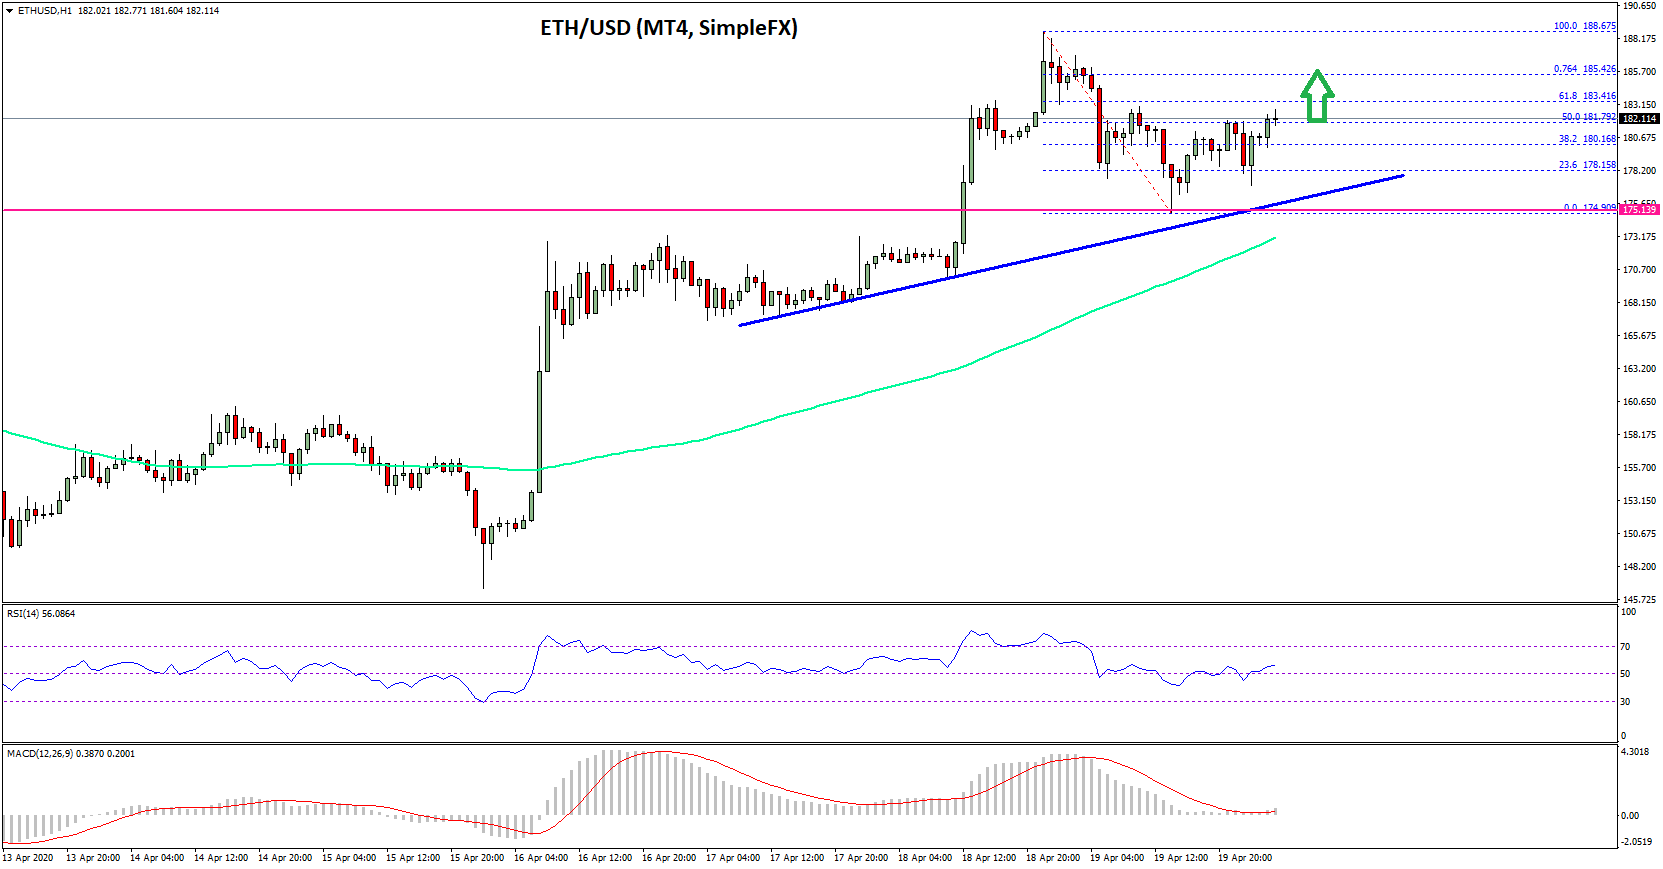
The recent low was formed near $175 and Ethereum is currently rising. There was a break above the $180 level, plus the 50% Fib retracement level of the recent correction wave from the $188 high to $175 swing low.
On the upside, an initial hurdle for the bulls is near the $185 level. It is close to the 76.4% Fib retracement level of the recent correction wave from the $188 high to $175 swing low. A successful break above the $185 resistance level could open the doors for more gains above the $188 high.
The next resistance is near the $195 level, above which the bulls are likely to aim a test of the $200 handle in the near term.
Downside Correction?
On the downside, the $175 support area and the trend line hold a lot of importance. The next key support is near the $173 level or the 100 hourly simple moving average.
If there is a bearish break below the $175 and $173 support levels, there is a risk of a larger downside correction towards the $165 level.
Technical Indicators
Hourly MACD – The MACD for ETH/USD is slowly moving in the bullish zone.
Hourly RSI – The RSI for ETH/USD is currently just above the 50 level.
Major Support Level – $175
Major Resistance Level – $185
Image from unsplash


