
Reason to trust
How Our News is Made
Strict editorial policy that focuses on accuracy, relevance, and impartiality
Ad discliamer
Morbi pretium leo et nisl aliquam mollis. Quisque arcu lorem, ultricies quis pellentesque nec, ullamcorper eu odio.
Ethereum reacted to the downside after it failed to clear the $215 resistance against the US Dollar. ETH price is currently showing bearish signs and it could decline to $200 or $192.
- Ethereum is slowly moving lower and now trading well below the $215 resistance.
- The price is struggling to stay above $210 and the 100 hourly simple moving average.
- There is a major bearish trend line forming with resistance near $214 on the hourly chart of ETH/USD (data feed via Kraken).
- The pair is likely to continue lower below $205 and $200 as long as it is below $215.
Ethereum Price Likely To Lose Battle Near $215
Ethereum price made many attempts to clear the $216 resistance zone against the US Dollar, but it failed. ETH price formed a swing high near $215 and recently started a fresh decline.
There was a break below the $212 and $210 support levels. Ether even broke the $208 support and the 100 hourly simple moving average. However, the $205-$206 support zone stalled the recent decline.
A low is formed near $205 and the price is currently correcting losses. It tested the $210 level, which acted as a resistance. The 50% Fib retracement level of the recent decline from the $215 high to $205 low is also acting as a resistance.
On the upside, there are many hurdles forming near $214 and $215. There is also a major bearish trend line forming with resistance near $214 on the hourly chart of ETH/USD.
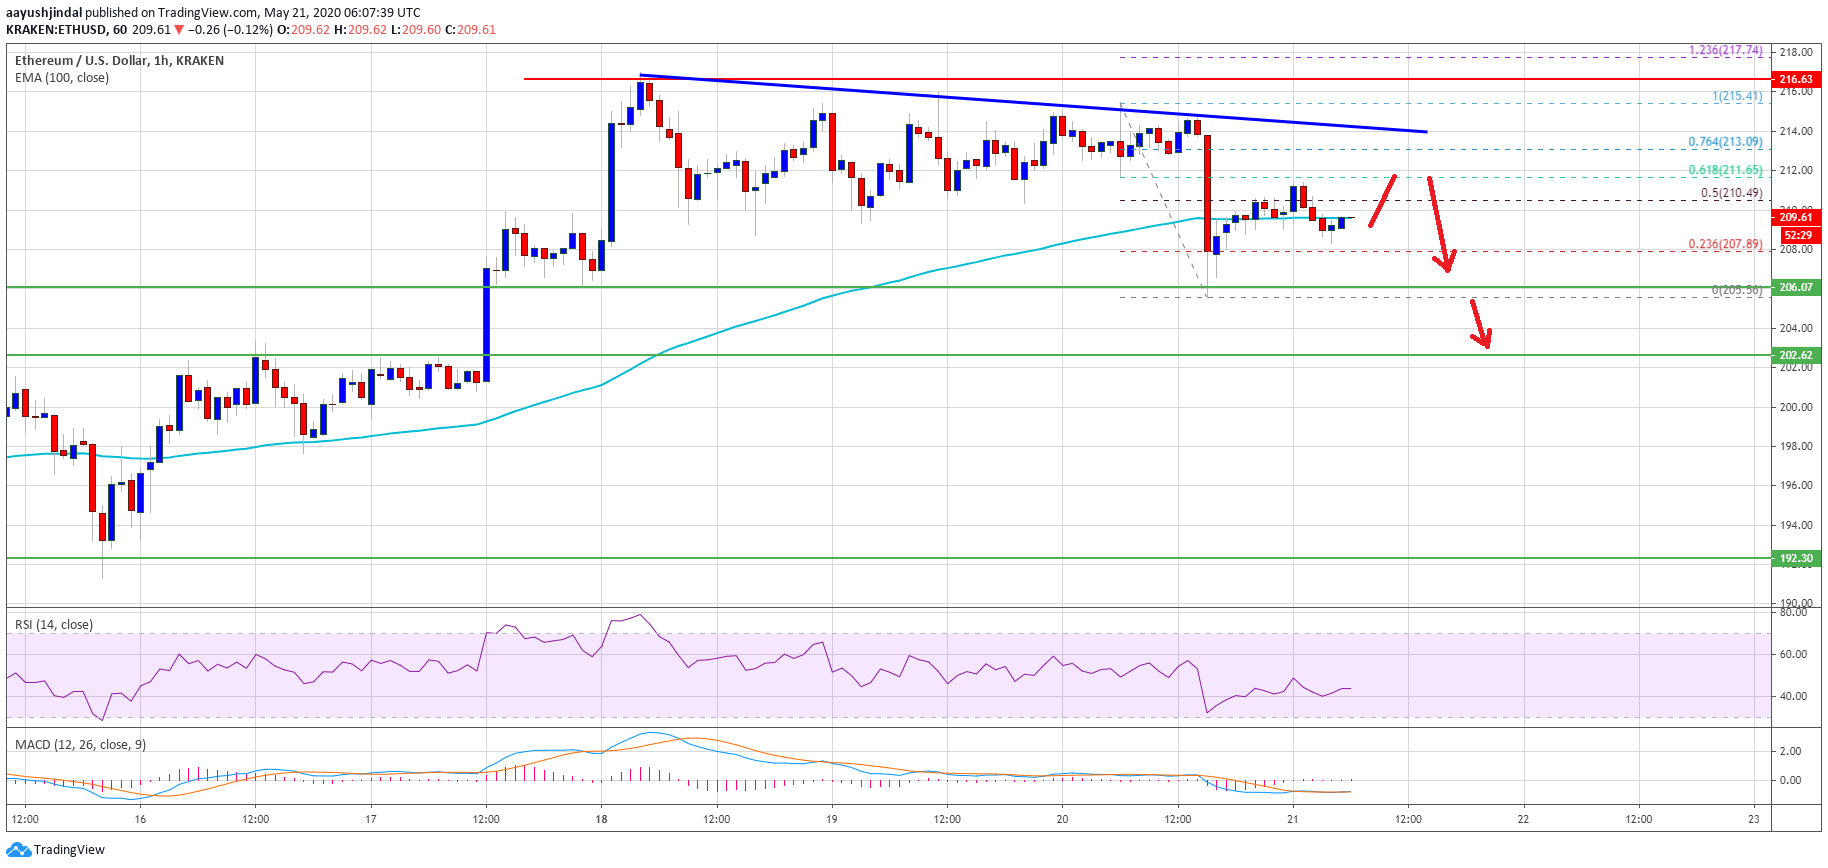
The trend line is close to the 76.4% Fib retracement level of the recent decline from the $215 high to $205 low. A clear break above the $215 resistance area is still a major task. If the bulls finally succeed, there are chances of a strong upward move towards the $220 and $230 levels.
More Losses?
If Ethereum fails to clear the $214 and $215 resistance levels, there could be another decline. The main support is near the $205 and $206 levels.
The current price action, the trend line resistance, and multiple rejections near $215 suggest chances of more losses. There three takeaways could lead the price below $205 in the near term.
If there is a downside break below the $206 and $205 support levels, the price is likely to accelerate towards the $200 level. Any further losses could open the doors for a larger decline towards the $192 support zone.
Technical Indicators
Hourly MACD – The MACD for ETH/USD is slowly gaining pace in the bearish zone.
Hourly RSI – The RSI for ETH/USD is now well below the 50 level, with a bearish angle.
Major Support Level – $205
Major Resistance Level – $215
Take advantage of the trading opportunities with Plus500
Risk disclaimer: 76.4% of retail CFD accounts lose money.


