
Reason to trust
How Our News is Made
Strict editorial policy that focuses on accuracy, relevance, and impartiality
Ad discliamer
Morbi pretium leo et nisl aliquam mollis. Quisque arcu lorem, ultricies quis pellentesque nec, ullamcorper eu odio.
Ethereum is up more than 20% from the $150 support area against the US Dollar, and gained traction vs bitcoin. ETH price is correcting lower, but it remains well supported.
- ETH price is showing a lot of positive signs above the $175 and $180 levels against the US Dollar.
- A new monthly high is formed near $190 and the price is currently correcting lower.
- There is a key connecting bullish trend line forming with support near $175 on the 4-hours chart of ETH/USD (data feed via Kraken).
- The pair is likely to bounce back as long as it is above the $178 and $175 support levels.
Ethereum Price is in Strong Uptrend
This past week, Ethereum started a strong rise from the $150 support area against the US Dollar. ETH price is up more than 20% and it broke many key hurdles near the $165 and $170 levels.
There was also a close above the main $175 resistance and the 100 simple moving average (4-hours). During the rise, there was a break above a crucial bearish trend line with resistance near $165 on the 4-hours chart of ETH/USD.
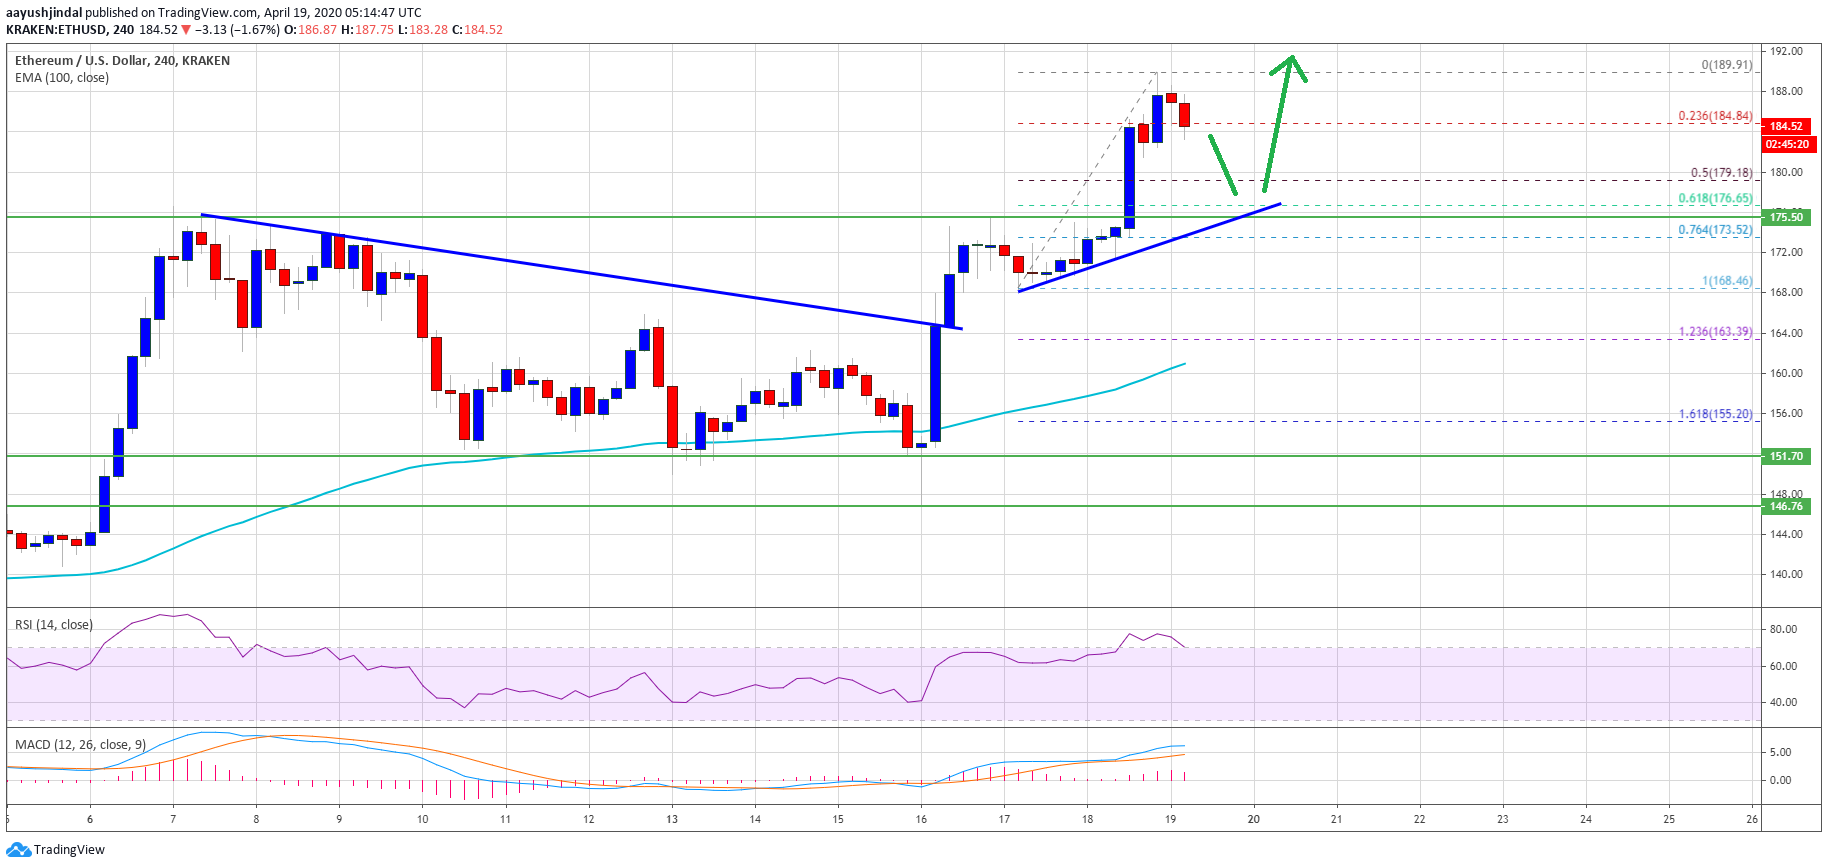
The pair extended its rise above $180 and tested the $190 zone. A new monthly high is formed near $190 and the price is currently correcting lower. Ethereum is testing the 23.6% Fib retracement level of the recent rally from the $168 swing low to $190 high.
On the downside, an initial support is near the $180 level. It is close to the 50% Fib retracement level of the recent rally from the $168 swing low to $190 high.
More importantly, there is a key connecting bullish trend line forming with support near $175 on the same chart. If the price fails to stay above the trend line and the $175 support, it could decline towards the $160 zone or the 100 simple moving average (4-hours).
Upside Extension
Once the current correction wave is complete, Ethereum might start a fresh rally above the $188 level. An initial resistance for the bulls is near the $190 level.
A successful close above the $190 resistance might open the doors for a larger rally towards the $200 and $205 levels in the near term.
Technical Indicators
4 hours MACD – The MACD for ETH/USD is slowly losing pace in the bullish zone.
4 hours RSI – The RSI for ETH/USD is currently correcting lower from the 70 level.
Major Support Level – $175
Major Resistance Level – $190
Take advantage of the trading opportunities with Plus500
Risk disclaimer: 76.4% of retail CFD accounts lose money.


