
Reason to trust
How Our News is Made
Strict editorial policy that focuses on accuracy, relevance, and impartiality
Ad discliamer
Morbi pretium leo et nisl aliquam mollis. Quisque arcu lorem, ultricies quis pellentesque nec, ullamcorper eu odio.
Ethereum is down close to 5% and it broke the $155 support area against the US Dollar. ETH price tested the main $145 support area and it is currently correcting higher.
- Ethereum struggled to clear the $160 resistance and decline below the $155 level.
- The bulls defended the main $145 support area (as discussed in the weekly analysis).
- There was a break below a major contracting triangle with support near $155 on the hourly chart of ETH/USD (data feed via SimpleFX).
- The pair must stay above the $145 support and recover above $155 to avoid more downsides.
Ethereum Price Nosedives
Yesterday, Ethereum made a couple of attempts to clear the $160 resistance area against the US Dollar. ETH price failed to gain bullish momentum above $160 and started a sharp decline.
There was a break below the key $155 support and the 100 hourly simple moving average. More importantly, there was a break below a major contracting triangle with support near $155 on the hourly chart of ETH/USD.
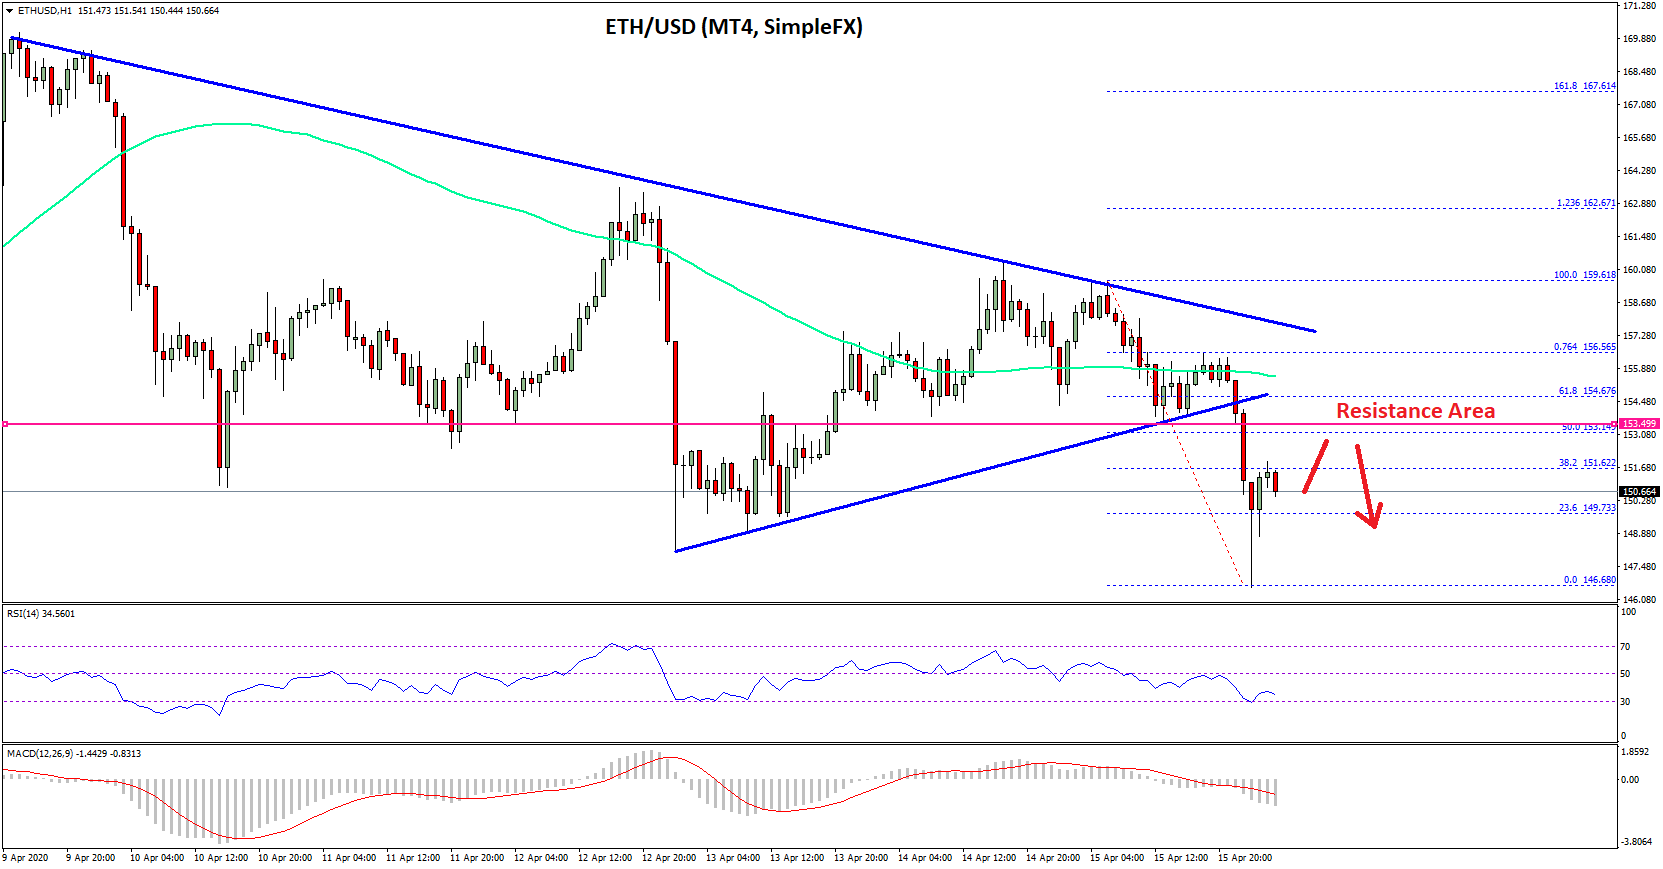
The pair even traded below the $148 swing low and tested the main $145 support area (as discussed in the weekly analysis). A new weekly low is formed near $146 and the price is currently correcting higher.
Ethereum surpassed the $150 level to start a decent recovery. The bulls pushed the price above the 23.6% Fib retracement level of the recent decline from the $160 swing high to $146 swing low.
On the upside, there is a strong resistance forming near the $155 level and the 100 hourly simple moving average (the recent breakdown zone). The 50% Fib retracement level of the recent decline from the $160 swing high to $146 swing low is also near the $155 level.
To move back into a positive zone, the price must clear the $155 resistance and make another attempt to surpass the key $160 resistance in the coming sessions.
Bearish Scenario
On the downside, there is a decisive support forming near the $145 level. If the bulls fail to keep Ethereum price above the $145 support, there is a risk of a sharp decline.
The next support below $145 is near the $136 level, below which the price could even decline towards the $124 support level in the near term.
Technical Indicators
Hourly MACD – The MACD for ETH/USD is currently reducing its bearish slope.
Hourly RSI – The RSI for ETH/USD is struggling to recover and it is below the 40 level.
Major Support Level – $145
Major Resistance Level – $155
Image from unsplash


