
Reason to trust
How Our News is Made
Strict editorial policy that focuses on accuracy, relevance, and impartiality
Ad discliamer
Morbi pretium leo et nisl aliquam mollis. Quisque arcu lorem, ultricies quis pellentesque nec, ullamcorper eu odio.
Ethereum is trading in a strong uptrend above the $230 pivot zone against the US Dollar. ETH price is likely to continue higher above the $245 and $250 resistance levels.
- Ethereum started a downside correction from the $250 resistance zone.
- The price corrected below the $240 level, but it found support near the $230 level.
- There is a major bullish trend line forming with support near $232 on the hourly chart of ETH/USD (data feed via Kraken).
- The pair is likely to continue higher above the $245 and $250 resistance levels.
Ethereum Price Could Revisit $250
Ethereum price is following a bullish path and it recently surged above the $240 level. ETH price gained pace and surged towards the $250 resistance zone, with a close above the 100 hourly simple moving average.
A high was formed near $250 before ether price corrected lower. There was a break below the $240 level, but the $230 level acted as a strong support. A low is formed near $229 and the price is currently rising.
There was a break above the $235 level and a connecting bearish trend line on the hourly chart of ETH/USD. The price spiked above the 50% Fib retracement level of the downward move from the $250 high to $229 low.
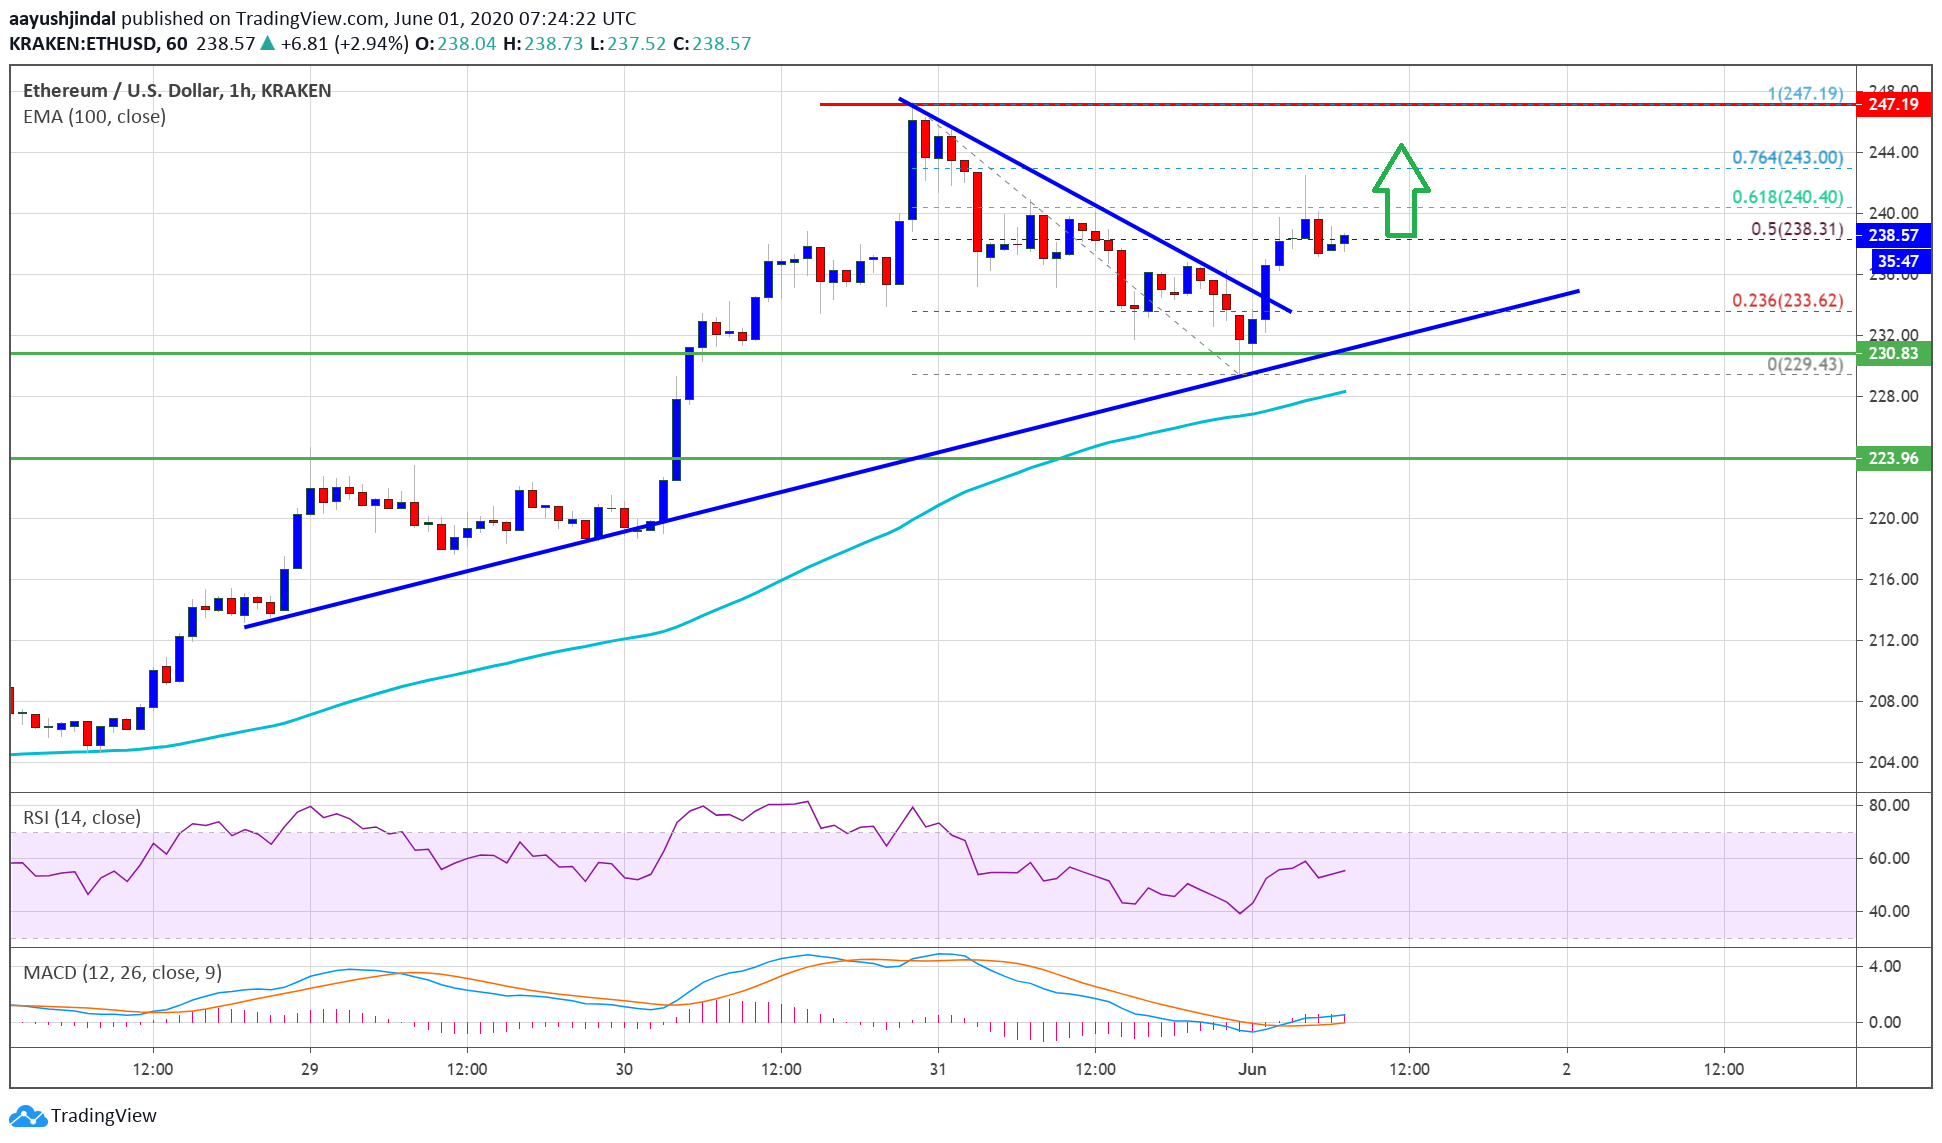
However, the price seems to be struggling near the $240 level. It is close to the 61.8% Fib retracement level of the downward move from the $250 high to $229 low. If Ethereum gains pace above the $240 level, it is likely to revisit the $250 resistance zone.
Any further gains could start another major rally and the price might break the $260 and $265 levels in the coming sessions.
Dips Supported in ETH
If Ethereum fails to continue above the $240 level or $245, there might be another correction. An initial support is near the $235 level. The first major support is seen near the $232 level.
There is also a major bullish trend line with support near $232 on the same chart. If the price breaks the trend line support and also clears the $230 level, there is a risk of a larger decline in the near term.
Technical Indicators
Hourly MACD – The MACD for ETH/USD is gaining momentum in the bullish zone.
Hourly RSI – The RSI for ETH/USD is now well above the 50 level, with a minor bearish angle.
Major Support Level – $232
Major Resistance Level – $245
Take advantage of the trading opportunities with Plus500
Risk disclaimer: 76.4% of retail CFD accounts lose money.


