
Reason to trust
How Our News is Made
Strict editorial policy that focuses on accuracy, relevance, and impartiality
Ad discliamer
Morbi pretium leo et nisl aliquam mollis. Quisque arcu lorem, ultricies quis pellentesque nec, ullamcorper eu odio.
Ethereum failed to continue above the $210 resistance and declined recently against the US Dollar. ETH price must stay above $195 and $192 to avoid a major downtrend.
- Ethereum is still struggling to break the $210 and $215 resistance levels.
- The price might start a decent recovery wave as long as it is above the $192 support zone.
- There is a major bearish trend line forming with resistance near $205 on the hourly chart of ETH/USD (data feed via Kraken).
- The pair could avoid a significant decline if it breaks the $210 resistance zone.
Ethereum Price is Facing Hurdles
After two rejections near the $210 resistance, Ethereum price started a fresh decline against the US Dollar. Bitcoin price also declined below the $9,000 support, sparking a bearish wave in ETH below the $202 level.
The price broke the $200 support and tested the $198 level. A low is formed near $198 and the price is currently correcting higher. There was a break above the $200 and $202 levels. Ether also climbed above the 23.6% Fib retracement level of the recent decline from the $210 high to $198 low.
On the upside, there is a strong resistance forming near the $205 level and the 100 hourly simple moving average. There is also a major bearish trend line forming with resistance near $205 on the hourly chart of ETH/USD.
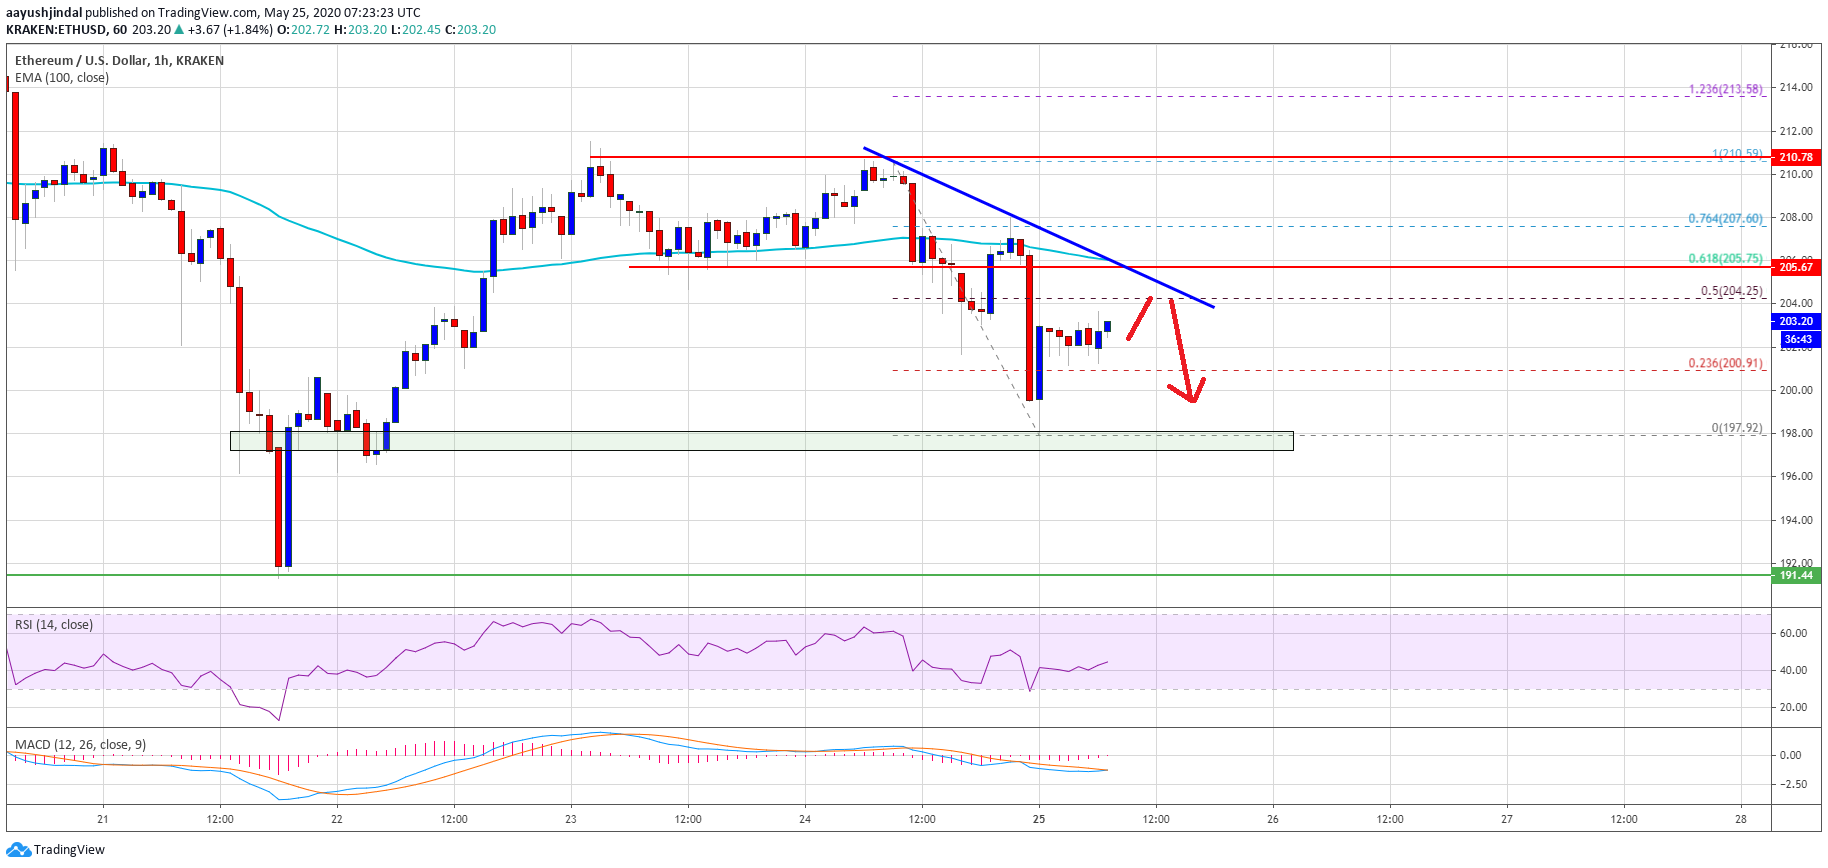
The trend line is close to the 50% Fib retracement level of the recent decline from the $210 high to $198 low. If there is an upside break above the $205 resistance, the price could make another attempt to clear the $210 resistance zone.
If the bulls succeed in clearing the $210 resistance, the price could avoid a major downtrend and it might continue to move higher towards the $220 and $230 levels.
More Losses
If Ethereum fails to clear the $205 and $210 resistance levels, the price could resume its decline. If there is a downside break below the $200 support, the price could even trade below the $198 low.
In the mentioned case, the price could dive towards the $192 support level. Any further losses may perhaps start a major downtrend in the coming sessions.
Technical Indicators
Hourly MACD – The MACD for ETH/USD is about to move back into the bullish zone.
Hourly RSI – The RSI for ETH/USD is now correcting higher towards the 50 level.
Major Support Level – $198
Major Resistance Level – $205
Take advantage of the trading opportunities with Plus500
Risk disclaimer: 76.4% of retail CFD accounts lose money.


