Key Highlights
- Ethereum classic price failed to remain in the bullish and moved below $16.00 against the US Dollar.
- There is a new connecting bearish trend line with resistance at $15.60 forming on the hourly chart of ETC/USD (Data feed via Kraken).
- The price might continue to move down and could even test the $15.00-14.80 support zone.
Ethereum classic price is following a bearish path versus the US Dollar and Bitcoin. ETC/USD may soon test the all-important $15.00-14.80 support zone.
Ethereum Classic Price Support
Recently, ETC price managed to move above the $16.00 handle against the US Dollar. The price traded above the 100 hourly simple moving average and traded towards the $16.50 level. However, it failed to retain the bullish momentum, faced sellers and moved down below $16.00. The price tested the $15.00-14.80 support zone once and bounced back. However, it failed to stay above the 16.00 level and the 100 hourly simple moving average.
A new connecting bearish trend line with resistance at $15.60 on the hourly chart of ETC/USD protected gains. The pair is now below the 50% Fib retracement level of the last wave from the $14.82 low to $15.97 high. There is a chance that the price might continue to move down towards the $15.00-14.80 support zone. On the upside, an initial resistance is around the $15.40 level and the 100 hourly simple moving average.
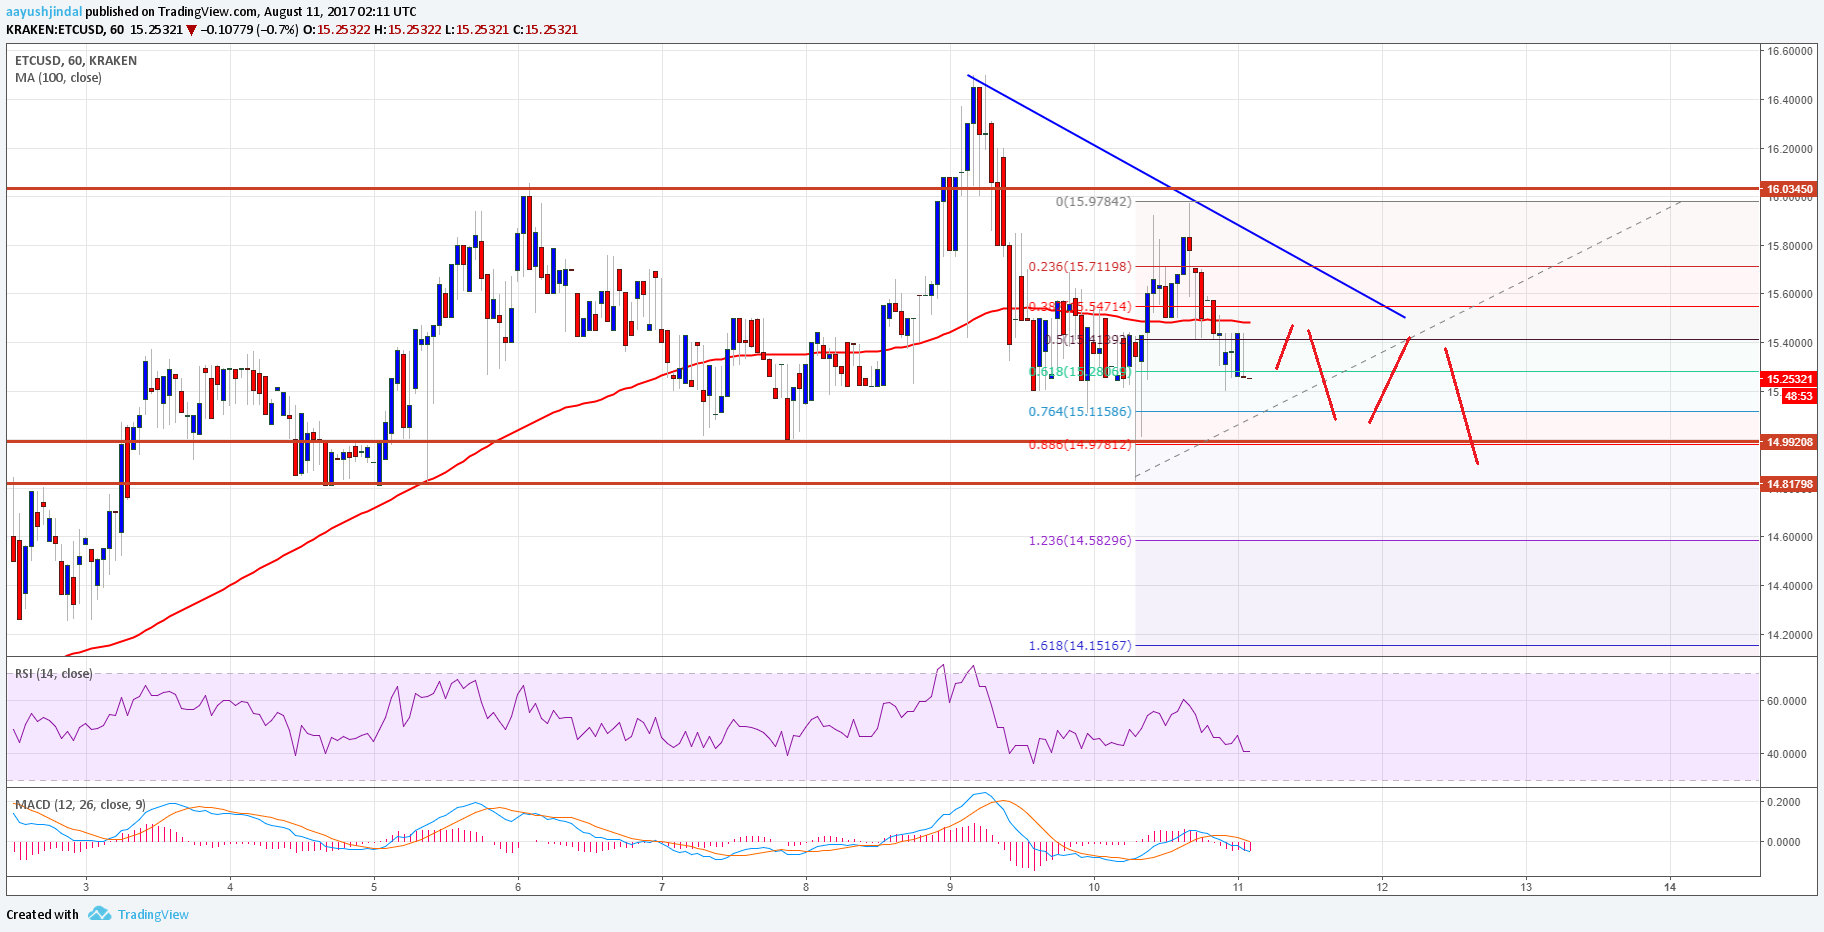
On the downside, the $15.00-14.80 support zone holds a lot of importance. Either one may consider selling near $15.60 or buy in the short term near $14.80 with a tight stop. It seems like the price may consolidate above $14.80 before making the next move.
Hourly MACD – The MACD is moving to and fro in the bearish zone.
Hourly RSI – The RSI is currently well below the 50 level and looks set to extend declines.
Major Support Level – $14.80
Major Resistance Level – $15.60
Charts courtesy – Trading View, Kraken