Key Highlights
- Ethereum classic price is holding gains nicely above $15.00 against the US Dollar and looking for more gains.
- There is an ascending channel pattern with resistance near $17.10 forming on the hourly chart of ETC/USD (Data feed via Kraken).
- The price is currently trading near a major resistance area at $16.50 and looking for a break.
Ethereum classic price is trading with a positive bias versus the US Dollar and Bitcoin, and ETC/USD has to clear $16.50-17.00 for more upsides.
Ethereum Classic Price Resistance
There were mostly positive gains in ETC price above $15.00 against the US Dollar. The price was mostly supported by the $15.00 and $14.00 support levels. As mentioned in the last analysis, a recovery wave from the $12.80 low gained momentum. There was a move above the 38.2% Fib retracement level of the last decline from the $19.65 high to $12.82 low. The price was even able to settle above the $15.50 level and the 100 hourly simple moving average.
However, there is a major hurdle near $16.50. The $16.50 level represents a major pivot area and must be breached for more gains. It also coincides with the 50% Fib retracement level of the last decline from the $19.65 high to $12.82 low. Moreover, there is an ascending channel pattern with resistance near $17.10 forming on the hourly chart of ETC/USD. So, we can say that the price faces a crucial test near $16.50-17.00. A break above it could open the doors for a move towards $20.00.
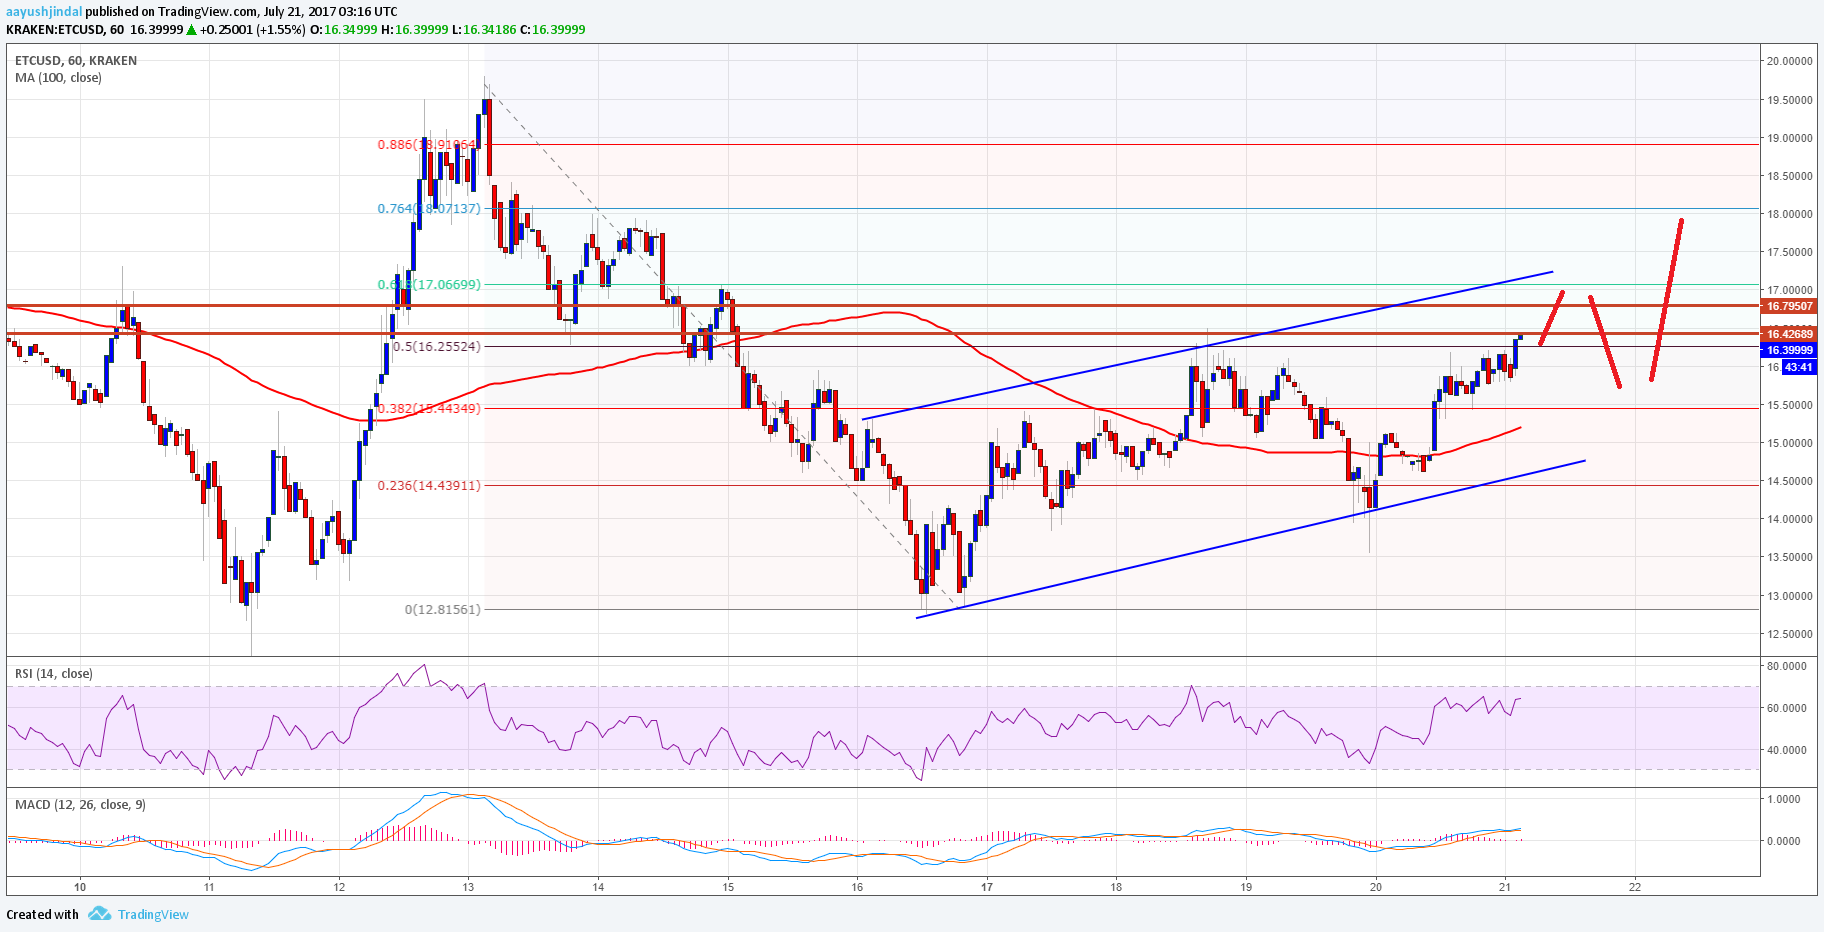
On the downside, the $15.50 support and the 100 hourly simple moving average may continue to prevent declines. The channel support at $14.80 is also a good buy zone. As long as the price is above $14.80, it may break higher.
Hourly MACD – The MACD is mostly flat in the bullish zone.
Hourly RSI – The RSI is well above the 50 level.
Major Support Level – $14.80
Major Resistance Level – $16.50
Charts courtesy – Trading View, Kraken