Reason to trust

How Our News is Made
Strict editorial policy that focuses on accuracy, relevance, and impartiality
Ad discliamer
Morbi pretium leo et nisl aliquam mollis. Quisque arcu lorem, ultricies quis pellentesque nec, ullamcorper eu odio.
Key Highlights
- The Dogecoin price moved higher recently and managed to break an important bearish trend line on the hourly chart.
- Our previously highlighted resistance on the daily chart at 40.0 Satoshis acted as a barrier for buyers and stalled gains.
- The broken trend line may now act as a support for the price if it moves lower.
Dogecoin price might correct lower and present us a buying opportunity, but we need to be very careful as there is still a major resistance at 40.0 Satoshis.
Can Buyers Clear 40.0 Satoshis?
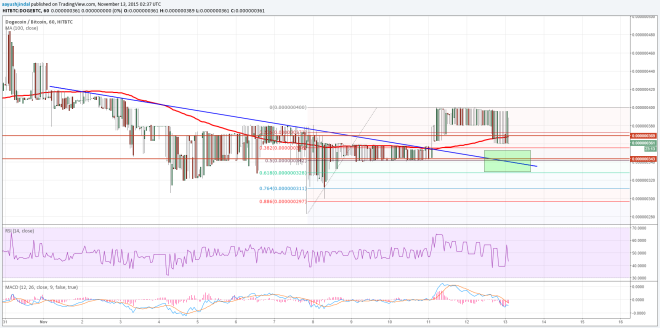
Finally, there was a sign of relief for the Dogecoin buyers, as the price managed to break a major bearish trend line formed on the hourly chart (data feed from HitBTC). The best part was the fact that the price also settled above the 100 hourly simple moving average (MA), and currently showing positive signs.

There is a chance of the price correcting lower and finding support around the broken trend (Hourly chart), as it is also coinciding with the 50% Fib retracement level of the last move from the 28.3 Satoshis (low) to 40.0 Satoshis (high).
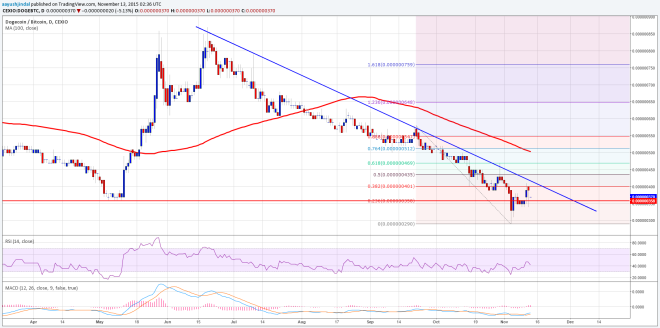
However, at the same time when we look at the daily timeframe chart of the Dogecoin price (data feed from CEX.IO), then we get to know that there is a monster resistance around 40.0 Satoshis. There is also a bearish trend line formed via connecting all major recent swing highs.

Furthermore, the bearish trend line on the daily timeframe is also positioned with the 38.2% Fib retracement level of the last drop from the 57.8 Satoshis (high) to 29.0 Satoshis (low) that suggests the importance of the 40.0 Satoshis resistance area.
Looking at the indicators:
Daily MACD – The daily MACD is favoring sellers at the moment and suggesting a minor correction lower is possible moving ahead.
Hourly RSI – It is below the 50 level, supporting sellers.
Intraday Support Level – 34.0 Satoshis
Intraday Resistance Level – 40.0 Satoshis
Charts from HitBTC and CEX.IO; hosted by Trading View


