Reason to trust

How Our News is Made
Strict editorial policy that focuses on accuracy, relevance, and impartiality
Ad discliamer
Morbi pretium leo et nisl aliquam mollis. Quisque arcu lorem, ultricies quis pellentesque nec, ullamcorper eu odio.
Dogecoin price remained within the 57-60 satoshi range throughout yesterday on Hitbtc. Last month, we began to notice that dogecoin price started to exhibit independence of bitcoin price, but as bitcoin price increased earlier today, can this throw its shadows on the dogecoin charts?
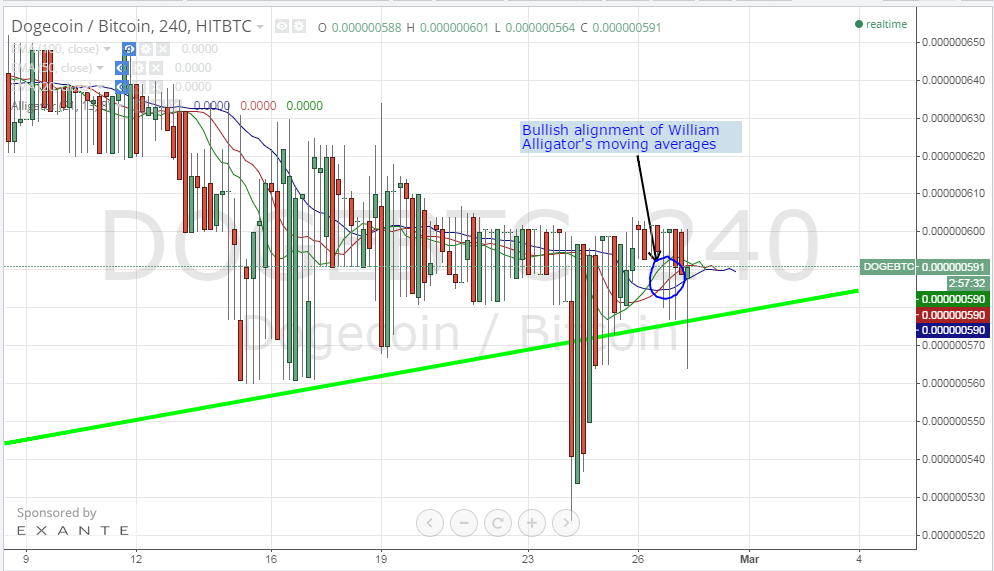
By studying the 4 hour Hitbtc (DOGE/BTC) chart from Hitbtc from tradingview.com and plotting the William’s Alligator indicator accordingly (look at the below chart), we can notice the following:
- The long downwards shadows of the candlesticks, as price approached the rising support level (green trend line), signal weakness of the market’s bears and may also mean that buying volume is accumulating gradually.
- Yesterday, we spotted perfect bullish alignment of the moving averages of William’s Alligator which was followed by a bullish candle as shown on the below chart. At the moment, the 3 moving averages are almost at the same level, so a perfect bullish realignment can be expected soon.
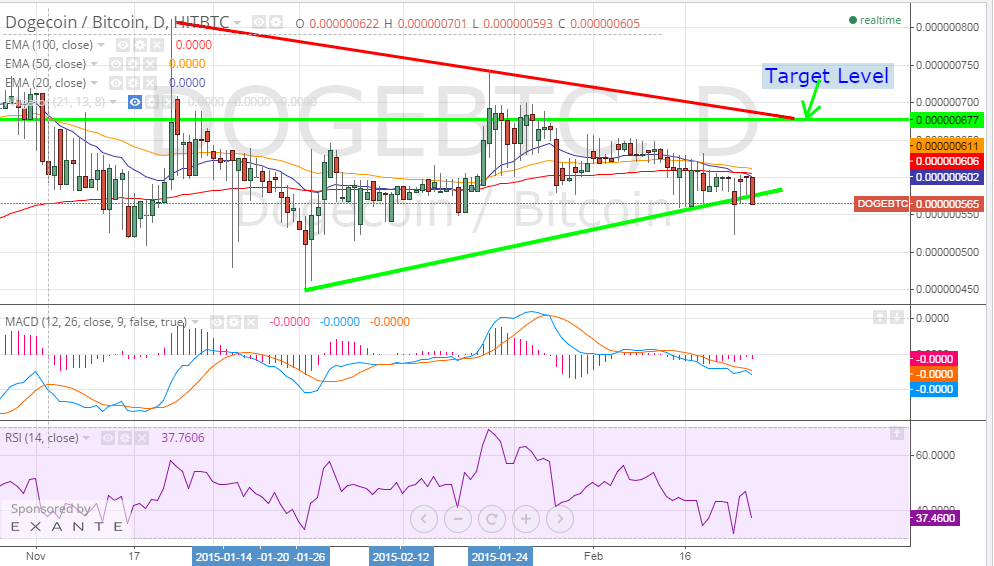
By studying the 1 day Hitbtc (DOGE/BTC) chart from tradingview.com and plotting the MACD indicator and RSI (look at the below chart), we can conclude the following:
- Since price reached a high of 80 satoshis on the 23rd of November, it has been moving along a wedged pattern with lower highs and higher lows as shown by the red and green trend lines on the below chart.
- MACD indicator is at zero level and doesn’t show signs of an upcoming bullish wave.
- The RSI is valued around 40 so dogecoin is neither overbought, nor oversold and we can see it travel either ways.
Conclusion:
Dogecoin price hasn’t been affected by the bullish wave that we noticed earlier today affecting bitcoin’s charts. Although the price of dogecoin is now relatively independent of bitcoin, technical analysis has a few signs signaling a few satoshi rise in price soon.
Charts from hitbtc


