Reason to trust

How Our News is Made
Strict editorial policy that focuses on accuracy, relevance, and impartiality
Ad discliamer
Morbi pretium leo et nisl aliquam mollis. Quisque arcu lorem, ultricies quis pellentesque nec, ullamcorper eu odio.
Despite yesterday’s bitcoin price drop, dogecoin price ranged between 58.2 and 59.9 satoshis yesterday on Hitbtc which is somehow within the fixed range we pointed to during our yesterday’s analysis. However, the price ranged between 58 and 61 satoshis on Cryptsy.
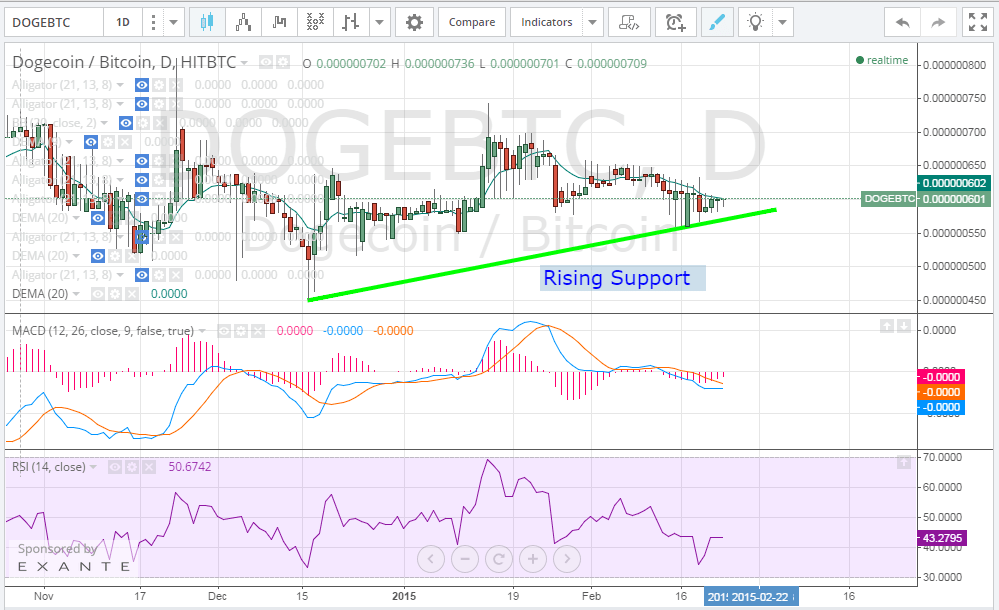
By studying the 1 day Hitbtc (DOGE/BTC) chart from tradingview.com, plotting the 20 day EMA, the RSI and MACD indicator (look at the below chart), we can conclude the following:
- Although the price range during the past 3 days has been almost the same, the lows are still trading along the rising support trend line we plotted in earlier analyses.
- The RSI is valued around 43 at the moment, so Dogecoin is currently neither oversold nor overbought, so it is likely to continue trading within the (56-62 satoshis) range for a few days.
- The MACD indicator’s value is around zero at the time of writing of this article and the red signal line has crossed below the MACD blue line on the 13th of February and this has remained unchanged since then. Accordingly, there are no signs of a bullish wave that can push the price up to higher levels soon.
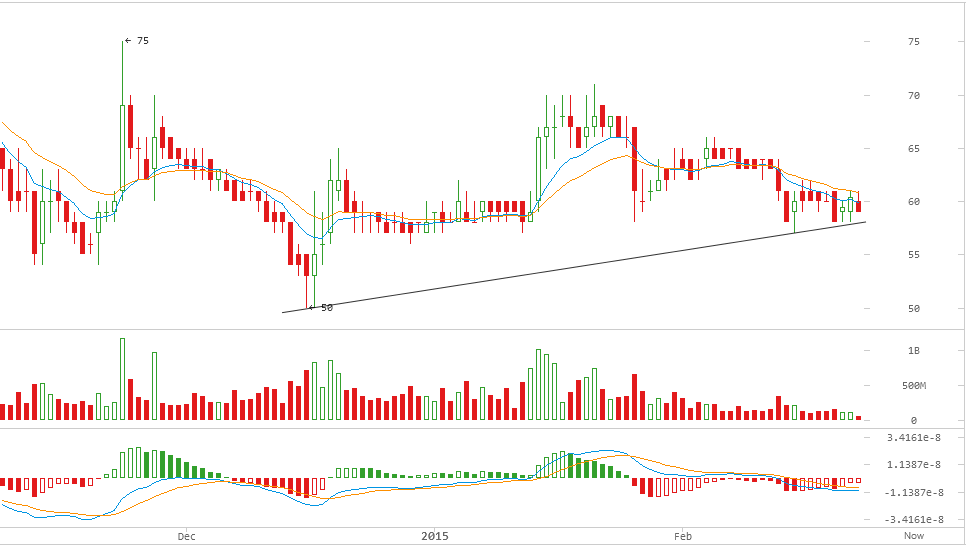
By studying the 1 day Cryptsy (DOGE/BTC) chart from bitcoinwisdom.com, plotting the 10 day EMA (green curve) and the 20 day EMA (orange curve) and calculating the MACD indicator (look at the below chart), we can conclude the following:
- Dogecoin price is currently below the 10 day and 20 day EMAs and the trading volume is low as compared to the volume earlier in February, so the price is likely not to rise soon.
- The MACD indicator’s value is around -1.3 which is somehow close to its value on Hitbtc’s charts, yet the red signal line has crossed above the blue MACD line, so it seems that the price will trade within its preferable range (56 and 62 satoshis).
Conclusion:
Dogecoin price remained within the range we spotted during our earlier analysis. Dogecoin continues to prove that its price is totally independent from that of bitcoin.
Charts from Hitbtc and Cryptsy


