Reason to trust

How Our News is Made
Strict editorial policy that focuses on accuracy, relevance, and impartiality
Ad discliamer
Morbi pretium leo et nisl aliquam mollis. Quisque arcu lorem, ultricies quis pellentesque nec, ullamcorper eu odio.
Dogecoin price traded between 58 and 60.7 satoshis on Hitbtc and between 58 and 60 satoshis on Cryptsy yesterday. Although the support level is rising on both Hitbtc’s and Cryptsy’s 1 day chart, it seems that Dogecoin price still prefers to stay within the 56 satoshis and 62 satoshis range.
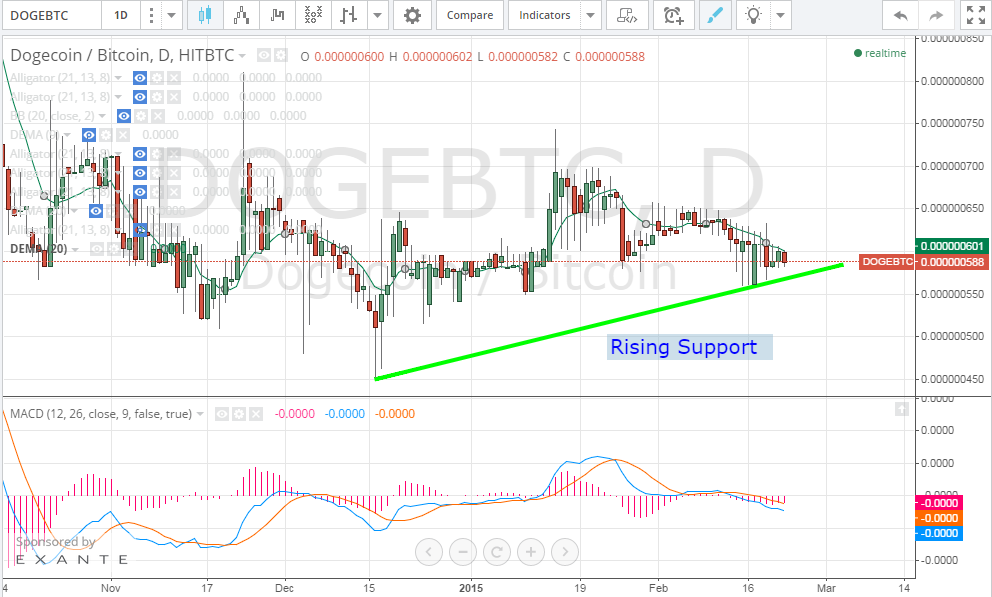
By studying the 1 day Hitbtc (DOGE/BTC) chart from tradingview.com and plotting the 20 day EMA and the MACD indicator accordingly (look at the below chart), we can notice the following findings:
- Dogecoin is now trading below the 20 day EMA and has been so during all of yesterday’s trading sessions which means that a bullish wave cannot be noticeable soon.
- Dogecoin price is continuing to trade according to the trend line we plotted during our earlier analysis. Strong support is evident by long shadows of the candlesticks on the 1 day charts as they approach the green trend line on the below chart.
- The MACD indicator value is now (0) and the red signal line has crossed above the blue MACD line. The MACD blue line should cross above the red signal line and the value of the MACD should enter the positive territory, before we can see a noticeable uptrend.
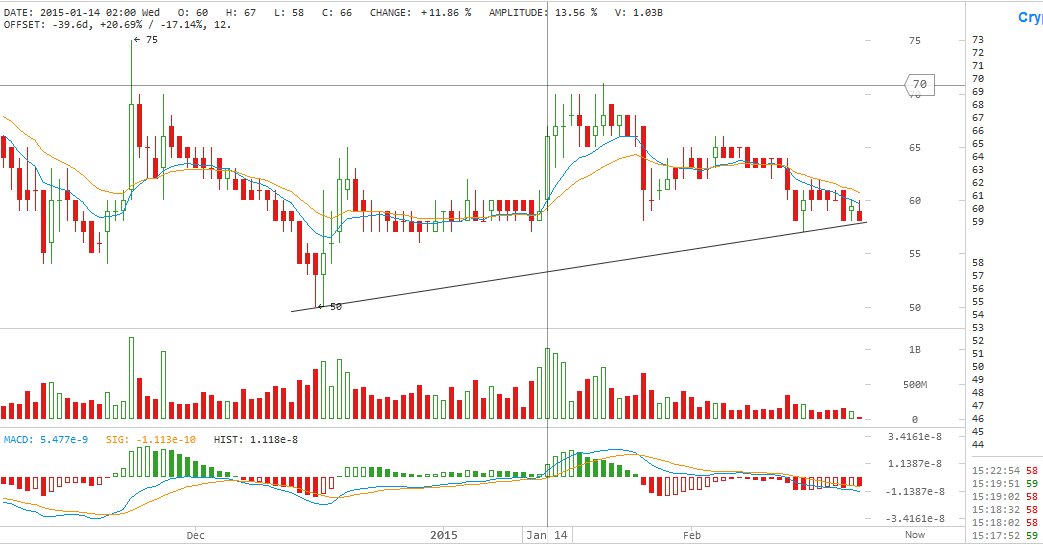
By studying the 1 day Cryptsy (DOGE/BTC) chart from tradingview.com and plotting the MACD indicator accordingly (look at the below chart), we can notice that trading across Cryptsy’s platform almost mirrors what is happening across Hitbtc. Rising support level is also noticeable on the charts from Cryptsy as shown by the black trend line on the below chart. The MACD red signal line has also crossed over the MACD blue line, yet the value of the MACD is in the negative territory.
Conclusion:
Dogecoin price is still trading within the range we have spotted earlier this week (56-62 satoshis). Our technical analysis concludes that dogecoin will continue to trade within this range during the upcoming 48 hours.
Charts from Hitbtc and Cryptsy


